
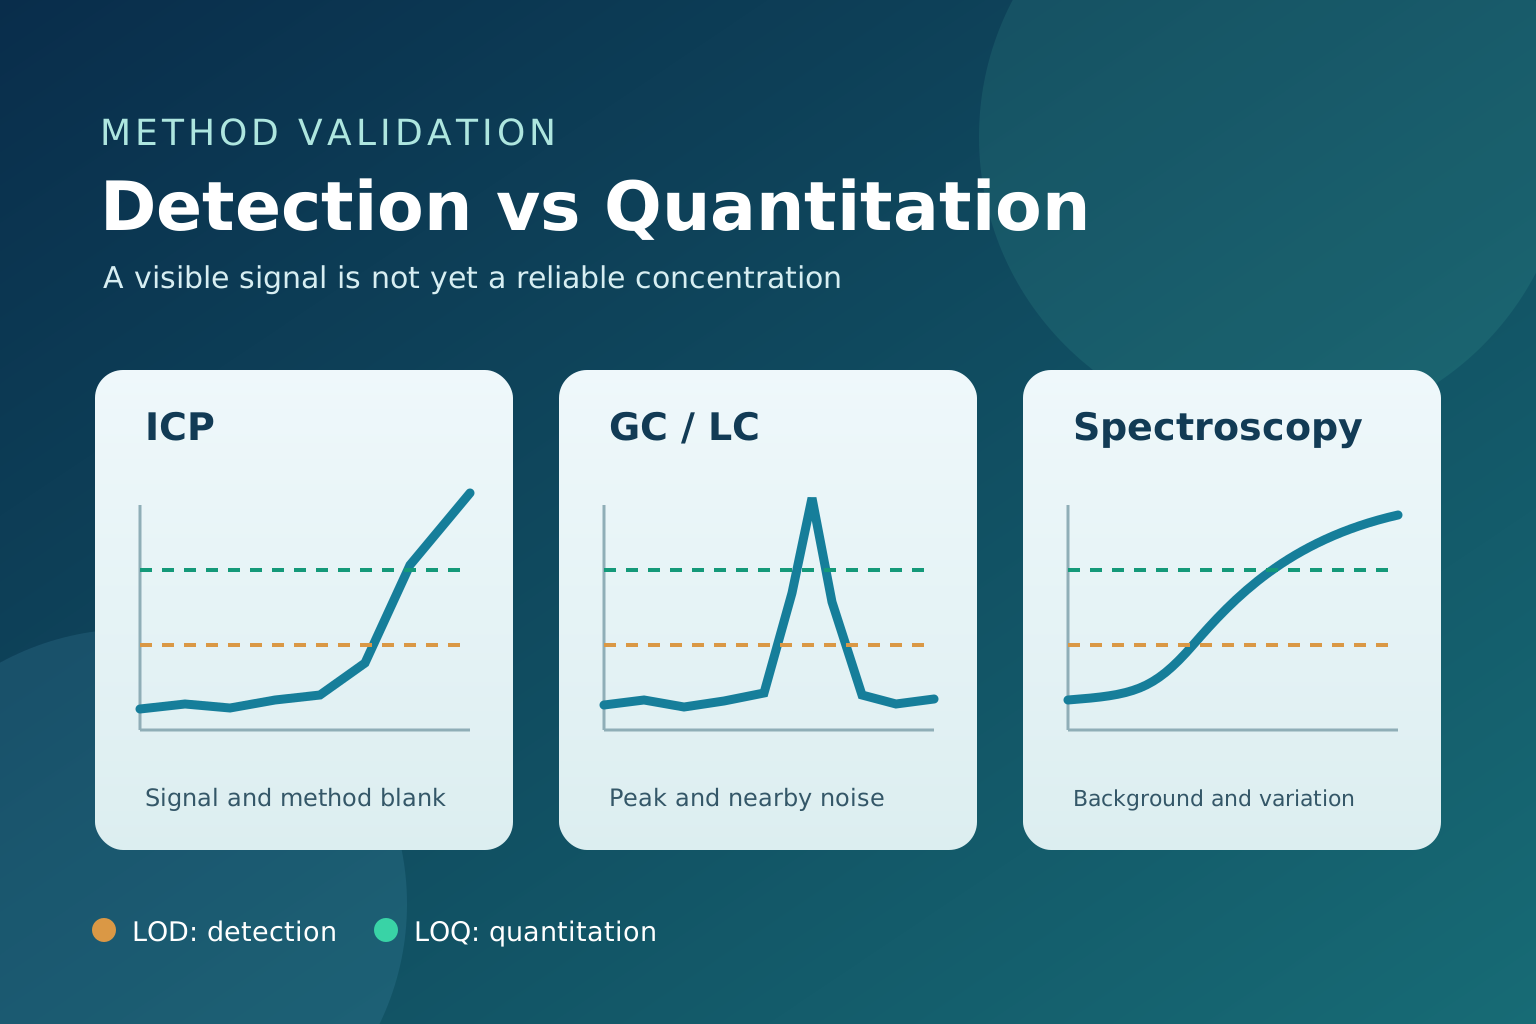
When measuring trace components, seeing a peak and reporting a reliable concentration are different achievements. The limit of detection (LOD; “DL” in ICH Q2(R2)) is the lowest level at which the analyte can be judged present under a stated decision rule. The limit of quantitation (LOQ; “QL” in ICH Q2(R2)) is the lowest level at which a numerical result can be obtained with accuracy and precision acceptable for its intended purpose. The LOD is usually below the LOQ.
This guide explains how to estimate and verify these limits and what to check for inductively coupled plasma mass spectrometry (ICP-MS), inductively coupled plasma optical emission spectrometry (ICP-OES), gas chromatography (GC), liquid chromatography (LC) and spectroscopic methods.
First, distinguish detection from quantitation
↔ 表が見切れている場合は、左右にスクロールしてご覧ください。↔ Scroll the table horizontally to see any hidden columns.
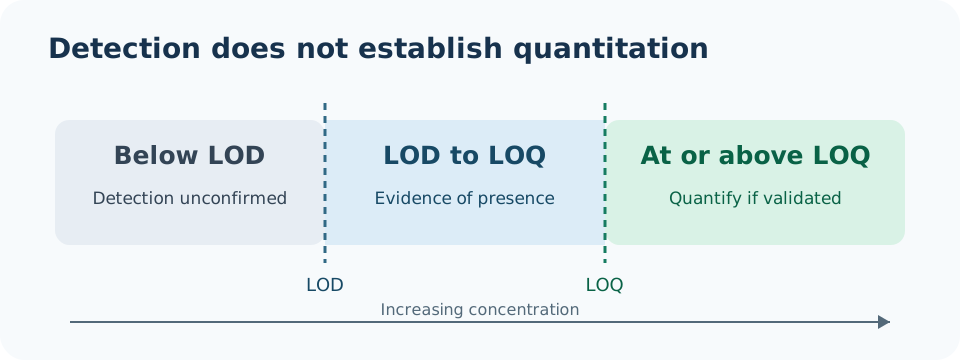
| Position of a result | What it supports | Important qualification |
|---|---|---|
| Below the LOD | Detection cannot be confirmed under this method's decision rule | It does not mean the analyte concentration is zero |
| At or above the LOD, below the LOQ | Evidence of presence exists, but the concentration result may lack adequate performance | Whether to report a number depends on the method and reporting rules |
| At or above the LOQ | Quantitation is possible within the verified range and conditions | Also check the upper end of the calibration range |
Distinguish an instrument limit, determined from the measuring instrument alone, from a method limit that includes sampling, extraction or digestion, dilution and measurement. A limit cannot be compared meaningfully without its blank type, sample matrix, analyte, signal, preparation and calculation basis. A laboratory may set its reporting limit above the verified LOQ to account for the lowest calibration point or operational requirements.
Three ways to estimate a candidate limit
1. Measure real low-level samples
Take samples of known low concentration through the complete analytical procedure. The lowest level at which the analyte can be identified is a candidate LOD. For a candidate LOQ, prepare independent replicates and examine recovery or bias, standard deviation (SD), relative standard deviation (RSD), interference and back-calculated concentrations. A calculated candidate becomes a usable method LOQ only after its performance is checked in conditions close to real samples.
2. Use the signal-to-noise ratio (S/N)
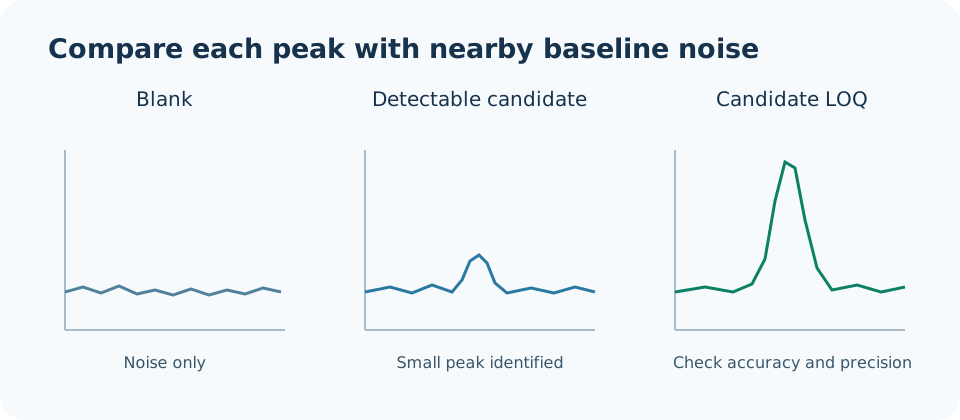
Where baseline noise can be defined, ICH Q2(R2), section 3.2.3.2 describes approximately 3:1 for a detection-limit estimate and at least 10:1 for a quantitation-limit estimate. The cited PDF includes the 2025 corrections. Fix the location and width of the noise window, the signal definition (such as peak height or area) and the integration settings. An S/N of 10 does not establish a method LOQ if extraction recovery or preparation precision is inadequate.
3. Use response variability and calibration slope
For a linear response, ICH Q2(R2) gives these estimates:
LOD = 3.3 × σ / S; LOQ = 10 × σ / S
Here, σ is the standard deviation of the response and S is the calibration slope. If σ is 0.6 signal units and S is 20 signal units per µg/L, the estimates are LOD = 0.099 µg/L and LOQ = 0.30 µg/L. These are estimates: independently prepared samples near 0.30 µg/L must demonstrate suitable accuracy and precision before that level is adopted as the LOQ. Possible estimates of σ include the SD of residuals near the lower end or the SD of intercepts from several calibration curves. Do not extrapolate a low-end limit from residuals measured only at high concentrations. See ICH Q2(R2).
↔ 表が見切れている場合は、左右にスクロールしてご覧ください。↔ Scroll the table horizontally to see any hidden columns.
| Approach | Often useful for | Common pitfall |
|---|---|---|
| Direct low-level samples | Any method | Omitting preparation, matrix or between-day variation |
| S/N | GC/LC peaks or clear spectral peaks | Changing the noise window or processing settings changes the result |
| σ/S | Linear calibration response | The choice of σ and validity of the low-concentration region matter |
Repeated blank measurements are another approach. However, a simple “blank mean + 3 SD” should not automatically be presented as a concentration LOD when results can be negative, blank signals are nearly constant or variance changes with the matrix. State the statistical decision rule and conversion used. See the Eurachem method validation guide, third edition (2025), section 5.3.
For ICP-MS and ICP-OES
For ICP, separate the limit in the measured solution from the limit in the original sample. If the measured-solution LOQ is 0.20 µg/L, 0.50 g of sample is digested and made up to 50 mL, and there is no further dilution, the original-sample LOQ is 0.020 mg/kg.
Original-sample LOQ (mg/kg) = measured-solution LOQ (µg/L) × final volume (L) × additional dilution factor ÷ sample mass (g).
The units in this expression convert µg/g to the numerically equal mg/kg. Halving the sample mass doubles the original-sample LOQ. Acid, container and reagent contamination; polyatomic ions and isobars in ICP-MS; and spectral-line overlap and background correction in ICP-OES can all affect the limit. The Japanese guides on choosing between ICP-MS and ICP-OES and specificity provide related context.
For verification, independently prepare both a method blank that passes through the entire preparation and low-level spiked samples in representative matrices; a reagent blank alone is insufficient. Set limits for each element and monitored mass or wavelength, using results after the interference and internal-standard corrections that will be applied in routine work. Instrument sensitivity estimated only from ICP-MS counting noise or ICP-OES background noise is not a method limit that includes digestion.
For GC and LC
In chromatography, measuring noise near the analyte peak makes S/N intuitive. Yet baseline drift, coelution, ghost peaks, retention-time shifts and integration choices affect whether a small peak can be distinguished. With mass-spectrometric detection, also check the qualifier-ion ratio and retention time, not only the quantifier ion.
If a method includes extraction, cleanup, concentration or derivatization, repeated injections of a standard solution do not establish its method LOQ. Spike the matrix near the candidate limit and process independently prepared samples. With an internal standard, examine its response loss or interference as well as the concentration corrected by the peak-area ratio. Strong matrix effects in LC-MS can make the limit in solvent different from that in a real matrix.
For spectroscopic methods
In ultraviolet–visible (UV–Vis) absorption and fluorescence measurements, blank absorbance or fluorescence variability and the calibration slope can provide candidate limits. If a color-forming reaction is used, include the reagent blank, reaction time, temperature, cell positioning, turbidity and scattering in low-level replicate studies. For fluorescence, check quenching and inner-filter effects that may cause nonlinearity.
For multivariate quantitation by infrared (IR), Raman or near-infrared spectroscopy, the S/N of one wavelength may not describe the LOQ of the predicted concentration. Use low-level samples independent of model calibration to assess prediction bias, scatter, composition differences between samples and the model's applicability range. Changing smoothing or baseline correction to make S/N look better does not itself improve quantitative performance.
Compare the methods
↔ 表が見切れている場合は、左右にスクロールしてご覧ください。↔ Scroll the table horizontally to see any hidden columns.
| Check | ICP-MS / ICP-OES | GC / LC | Spectroscopy |
|---|---|---|---|
| Signal affecting the limit | Element response, background, interference | Peak, nearby noise, coelution | Absorption or emission, background, predicted value |
| Replicates including preparation | Digestion, final volume, dilution | Extraction, cleanup, derivatization | Reagent reaction, cell or sample positioning |
| Important blanks | Reagent, method, matrix | Solvent, method, matrix | Solvent, reagent, substrate |
| Low-level verification | Conversion to original-sample units; element-specific accuracy and precision | Peak identity, recovery and confirmation evidence | Background correction, nonlinearity and prediction error |
A practical decision sequence
- Define the reporting units, target matrix, required limit and decision rule.
- Estimate candidate LOD and LOQ values from method blanks and low-level samples.
- Prepare several independent samples at candidate concentrations and run the full routine procedure.
- Check specificity, accuracy, precision, the lowest calibration point and between-day variation.
- Adopt the lowest level that meets the predefined performance criteria; set the reporting limit and result notation.
- If sample mass, final volume, dilution or matrix changes, update the original-sample limit and verify the scope of applicability.
Set acceptance criteria before testing, in line with the analytical purpose and applicable standards. ICH Q2(R2) calls for confirmation near limits obtained by calculation or extrapolation; the LOQ may also be directly demonstrated through accuracy and precision near the lower end. See ICH Q2(R2).
Common misconceptions
↔ 表が見切れている場合は、左右にスクロールしてご覧ください。↔ Scroll the table horizontally to see any hidden columns.
| Misconception | What to verify instead |
|---|---|
| The lowest calibration standard automatically is the LOQ | Demonstrate accuracy and precision in actual low-level samples |
| S/N = 10 always permits quantitation | Include preparation recovery, interference and between-day variation |
| “Not detected” means zero concentration | It means detection was not confirmed under the specified decision rule |
| The instrument catalogue limit applies to samples | Check method blanks and conversion to original-sample units |
| Every sample has the same LOQ | Sample mass, dilution and matrix can change it |
Key points
The LOD concerns whether an analyte can be detected; the LOQ concerns whether its concentration can be measured with performance fit for purpose. S/N and σ/S help estimate candidates. Verify adopted limits with low-level samples taken through normal preparation. For ICP, conversion to original-sample units matters; for GC/LC, peak identity and preparation matter; and for spectroscopy, background and prediction error matter.
Related guide in English: calibration curves. Related Japanese guides: why method validation matters, specificity, trueness and precision.