

Trueness concerns how close the mean is to a reference value. Precision concerns how closely repeated results agree with each other. Suppose the reference value is 10.0 mg/kg and three independent preparations give 9.5, 9.6 and 9.7 mg/kg. The results cluster tightly, yet their mean is 0.4 mg/kg below the reference. Method validation examines both the bias and the spread.
Trueness, precision and accuracy
↔ 表が見切れている場合は、左右にスクロールしてご覧ください。↔ Scroll the table horizontally to see any hidden columns.
| Term | What it describes | How to assess it |
|---|---|---|
| Trueness | Agreement of the mean with a suitable reference value | Estimate bias or evaluate recovery |
| Precision | Agreement among replicate results under specified conditions | Calculate standard deviation or relative standard deviation |
| Accuracy | Closeness of a measured value to the true value | Consider both trueness and precision |
The International Vocabulary of Metrology (VIM) defines measurement trueness using the mean of an indefinitely large number of replicate measurements. In practice, use a finite set of results to estimate bias, the signed difference between the mean and the reference. State the quantity you report, such as relative bias or spike recovery. In pharmaceutical validation, the International Council for Harmonisation (ICH) uses *accuracy* in Q2(R2) for agreement with an accepted reference value. Read the term in the context of the applicable document. VIM 2.13–2.15 · ICH Q2(R2), Section 3.3
Compare three sets of results against the same reference
All values below are in mg/kg, with a reference of 10.0 mg/kg. Each row represents three independently prepared portions. The sample standard deviation (SD) describes the spread within each set.
↔ 表が見切れている場合は、左右にスクロールしてご覧ください。↔ Scroll the table horizontally to see any hidden columns.
| Results (mg/kg) | Mean (mg/kg) | Estimated bias (mg/kg) | SD (mg/kg) | What the example shows |
|---|---|---|---|---|
| 9.9, 10.0, 10.1 | 10.0 | 0.0 | 0.1 | The values cluster near the reference |
| 9.5, 9.6, 9.7 | 9.6 | −0.4 | 0.1 | The spread is the same, but the mean is low |
| 9.0, 10.0, 11.0 | 10.0 | 0.0 | 1.0 | The mean matches the reference and individual values are widely spread |
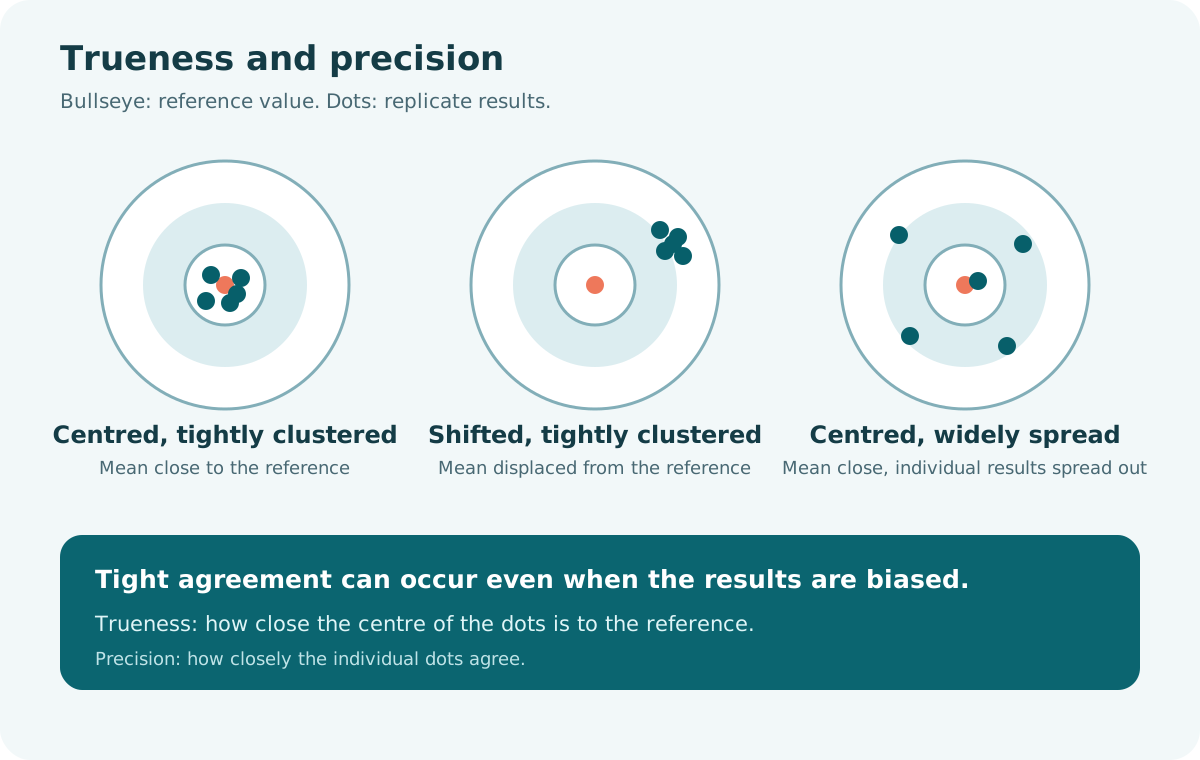
On the targets, the bullseye represents the reference value. The position of the centre of the dots illustrates trueness. The spread of the dots illustrates precision. These examples use three results for illustration. An actual study needs a design that represents the intended concentration range and matrices and accounts for reference-value uncertainty. Precision in analytical method validation (Japanese)
Choose a reference that matches the analytical task
↔ 表が見切れている場合は、左右にスクロールしてご覧ください。↔ Scroll the table horizontally to see any hidden columns.
| Approach | What it offers | What to verify |
|---|---|---|
| Certified reference material (CRM) | A certified value and its uncertainty, ideally in a representative matrix | Analyte, concentration, matrix and certified status of the value |
| Spike a sample with a known amount | Control over concentration levels and a way to investigate matrix effects | Existing analyte, independence of the spike standard, and when the spike is added |
| Prepare a material from a standard of known purity | A known target value in a designed sample or formulation | Purity, moisture, chemical form, weighing and volumetric uncertainty |
| Compare with a suitable independent method | Evidence from real samples analysed by another procedure | Bias and uncertainty of the comparison method |
ICH Q2(R2) describes reference materials, spiking and comparison with an orthogonal method. It gives three concentrations with three full-procedure replicates at each as one example for a study covering the reportable range. Report mean recovery or the difference from the reference with a suitable confidence interval or a justified alternative statistical interval. ICH Q2(R2), Section 3.3.1
How to calculate bias and recovery
Compare the mean with a certified or prepared value
- Recovery relative to the reference (%) = mean ÷ reference value × 100
- Estimated bias = mean − reference value
- Relative bias (%) = estimated bias ÷ reference value × 100
For the results 9.5, 9.6 and 9.7 mg/kg, the mean is 9.6 mg/kg. Against 10.0 mg/kg, the recovery relative to the reference is 96%, the estimated bias is −0.4 mg/kg and the relative bias is −4%. The sample SD is 0.1 mg/kg.
Calculate spike recovery by subtracting the unspiked result
Spike recovery (%) = (spiked result − unspiked result) ÷ amount added × 100
Split a representative sample and measure a spiked portion and an unspiked portion. If the unspiked result is 2.0 mg/kg, the equivalent of 5.0 mg/kg was added and the spiked result is 6.6 mg/kg, the measured increase is 4.6 mg/kg. The spike recovery is (6.6 − 2.0) ÷ 5.0 × 100 = 92%.
For example, adding 0.500 mL of a 100 mg/L standard to a 10.0 g sample adds 0.0500 mg, equivalent to 5.0 mg/kg on the original sample mass basis. Convert solution results in mg/L to the same sample basis using the final solution volume, dilution factor and sample mass. Dividing 6.6 by 5.0 without subtracting the unspiked result gives 132%, because it counts analyte that was already present. Eurachem method validation guide, 3rd edition
Spike before or after sample preparation?
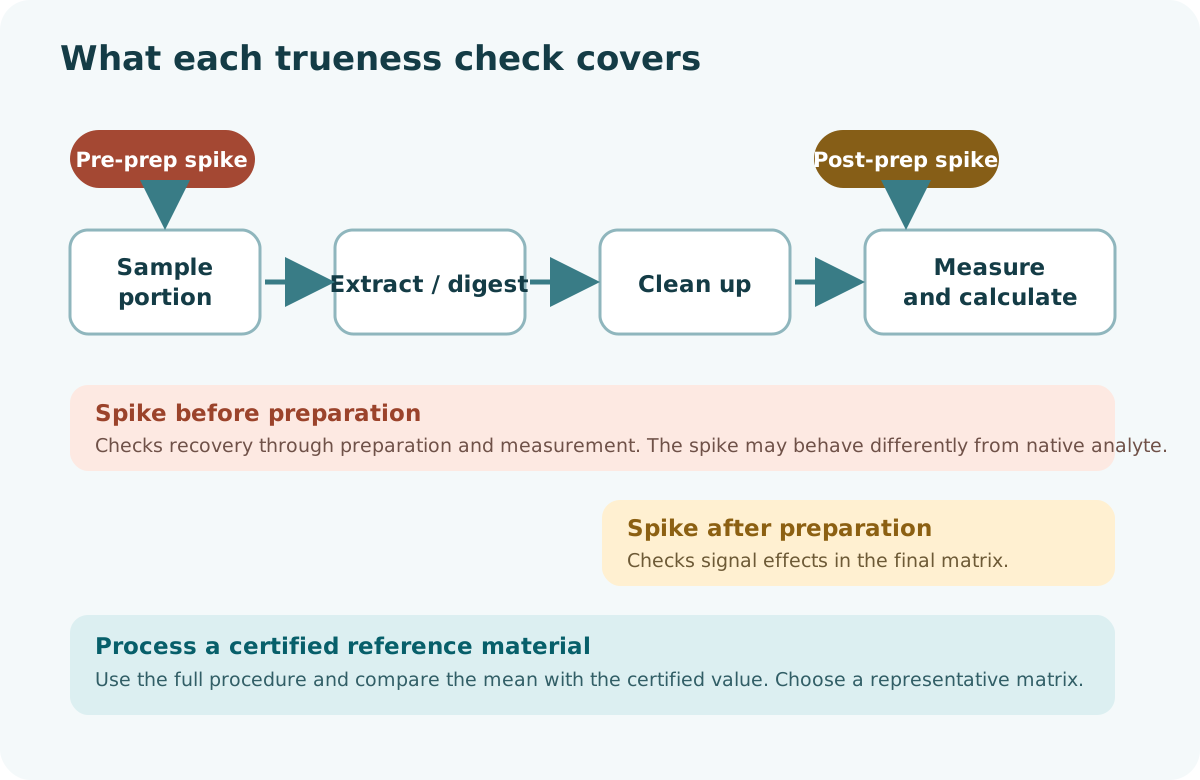
↔ 表が見切れている場合は、左右にスクロールしてご覧ください。↔ Scroll the table horizontally to see any hidden columns.
| Experiment | What it checks | Important limitation |
|---|---|---|
| Spike before preparation | Recovery of the spike through the steps that follow, including digestion or extraction, cleanup and measurement | The added analyte may behave differently from analyte originally present |
| Spike after preparation | Measurement-stage effects, including signal suppression or enhancement in the final matrix | Losses before the spike was added are outside its scope |
| Analyse a solvent standard | Standard preparation and instrument response | The result omits the sample matrix and preparation steps |
| Process a CRM through the full method | Overall bias relative to the certified value | The material must represent the relevant sample type and concentration |
Worked example: 72% before preparation and 96% after
↔ 表が見切れている場合は、左右にスクロールしてご覧ください。↔ Scroll the table horizontally to see any hidden columns.
| Portion from the same sample | Result on the original sample basis | Spike recovery |
|---|---|---|
| Unspiked | 2.0 mg/kg | — |
| Spiked before preparation at 5.0 mg/kg equivalent | 5.6 mg/kg | (5.6 − 2.0) ÷ 5.0 × 100 = 72% |
| Spiked after preparation at 5.0 mg/kg equivalent | 6.8 mg/kg | (6.8 − 2.0) ÷ 5.0 × 100 = 96% |
If this pattern recurs with the final matrix and measurement conditions matched, investigate extraction, adsorption, degradation or volatilisation during preparation. If post-preparation recovery is also low, check signal suppression, interference, dilution and calculations. Use a matrix-matched CRM where available to check the behaviour of analyte present in the original material. Analyte loss during sample preparation
Opposing effects can cancel. If 90% of the spike survives preparation and measurement enhances the signal by 11%, their combined effect is about 100% apparent recovery. Check several relevant levels and matrices, and use an independent reference where possible.
Trueness in ICP-MS and ICP-OES
For inductively coupled plasma mass spectrometry (ICP-MS) and inductively coupled plasma optical emission spectrometry (ICP-OES), evaluate digestion, dilution, interference correction and conversion to the reporting unit. Process a suitable CRM alongside routine samples. Check whether the assigned value is certified for the target element and account for its uncertainty.
- Low CRM results. Investigate incomplete digestion, volatilisation, precipitation, adsorption, overcorrection for interference and calculation errors.
- High CRM results. Investigate contamination, spectral interference, blank correction and standard preparation.
- Matrix effects. Compare pre- and post-digestion spikes. Check acid concentration, dissolved solids, the internal-standard response, and an alternative isotope or emission line where appropriate.
- Independent checks. Use an independently prepared or sourced standard if available. Standard additions can compensate for some matrix effects, while evaluating losses that occur before addition requires a separate check.
Choose a spike large enough to measure the difference reliably while keeping the total concentration relevant to the method. A soluble spike in a solid sample may behave differently from an element bound within a particle. US Environmental Protection Agency (EPA) Method 6020B
Trueness in gas and liquid chromatography
For gas chromatography (GC) and liquid chromatography (LC), add the spike before extraction, cleanup or derivatisation when those steps are in scope. Use a representative blank matrix where available. Compare a post-extraction spike with a solvent standard to investigate matrix effects such as ion suppression in liquid chromatography–mass spectrometry (LC–MS) or response changes at the GC inlet.
↔ 表が見切れている場合は、左右にスクロールしてご覧ください。↔ Scroll the table horizontally to see any hidden columns.
| Suspected source of bias | Useful comparison |
|---|---|
| Incomplete extraction or derivatisation | Pre-extraction or pre-reaction spike, re-extraction or a suitable CRM |
| Matrix effects | Post-extraction spike versus solvent standard |
| Degradation or adsorption | Storage-time and container-material comparisons |
| Coelution or integration bias | Spiked sample, alternative separation and inspection of the integration |
Add the internal standard at the same stage as in the routine method. Check analyte recovery independently of internal-standard stability. Residues incurred in real samples can behave differently from a fresh spike, so include a CRM, an incurred sample or a comparison with a suitable independent method where possible.
Trueness in spectroscopy
For ultraviolet–visible absorption (UV–Vis) and fluorescence, test representative matrices or samples with assigned values. Acidity, complexation, turbidity, quenching and inner-filter effects can bias results even when the calibration is linear. Inspect the full spectrum and a suitable blank.
For multivariate infrared (IR), Raman or near-infrared models, use a validation set independent of the calibration set. Compare predictions against reference values, inspect the scatter around the line of equality and examine mean bias as well as concentration-dependent bias. The root mean square error of prediction (RMSEP) describes overall prediction error. Compare it with the root mean square error of calibration (RMSEC) and assess whether the validation set represents expected variation in batches, temperature, moisture and particle size. ICH Q2(R2), Section 3.3.1.4
For quantitative nuclear magnetic resonance (NMR), compare independent preparations with a suitable reference material. Check signal overlap, relaxation delay, pulse settings, integration limits and internal-standard purity. Inadequate relaxation can bias signal ratios even with accurate weighing.
↔ 表が見切れている場合は、左右にスクロールしてご覧ください。↔ Scroll the table horizontally to see any hidden columns.
| Method | Reference to prioritise | Additional checks |
|---|---|---|
| ICP-MS or ICP-OES | CRM close to the sample matrix | Compare before and after digestion. Investigate interference using alternative isotopes or emission lines |
| GC or LC | CRM or a representative spiked blank matrix | Compare before and after extraction. Check separation, detection and integration |
| Spectroscopy | Samples with assigned values or an independent prediction set | Check whether absorption, scattering, quenching or model bias varies by matrix |
Set acceptance criteria before collecting data
Choose criteria for the intended use, concentration, sample matrix, specification limits, uncertainty and decision risk. Report individual results, mean recovery, bias, precision and a suitable statistical interval. For example, a mean of 100% can hide a consistent 90% recovery at low concentration and 110% at high concentration. Review the results by level as well as overall.
When recovery exceeds 100%, compare the result with the allowable range and expected spread. For a persistent high result, check matrix enhancement, coelution, spectral interference, subtraction of the unspiked result and the amount added. When comparing a measured mean with a CRM, include uncertainty in both the measurement and the certified value. Eurachem method validation guide, 3rd edition
Plan a trueness study
- Define the scope and criteria. Specify the analyte, matrices, reporting range and intended use.
- Select an appropriate reference. Choose a CRM, spike, independently prepared sample or comparison method.
- Choose representative levels and replicates. Prepare independent portions from the start of the steps you intend to evaluate. Repeat injections of one preparation cover a narrower part of the procedure.
- Calculate recovery or bias and its spread. Record the sample basis, calculation, precision and statistical interval.
- Check patterns and document the scope. Examine differences across concentrations, matrices, days or analysts. Compare the results with the criteria set before the study.
A high calibration correlation or a small relative standard deviation (RSD) can accompany a systematic shift. Examine an independent reference or a representative spike alongside the precision data. Why validate an analytical method? · Calibration curve basics
Common interpretation errors
↔ 表が見切れている場合は、左右にスクロールしてご覧ください。↔ Scroll the table horizontally to see any hidden columns.
| Observation | What to check next |
|---|---|
| A calibration curve has a high correlation coefficient | Check an independent reference to find out whether the concentrations are biased |
| A small RSD is reported | Check where the mean sits relative to the reference |
| Spike recovery is close to 100% | Check which steps the spike went through and whether opposing effects could cancel |
| An internal standard is stable | Verify analyte recovery and the assigned concentration of the standards |
| One concentration meets the criteria | Check other levels and matrices within the intended scope |
| Two methods agree | Check whether they share a source of bias, such as a common standard or preparation step |