
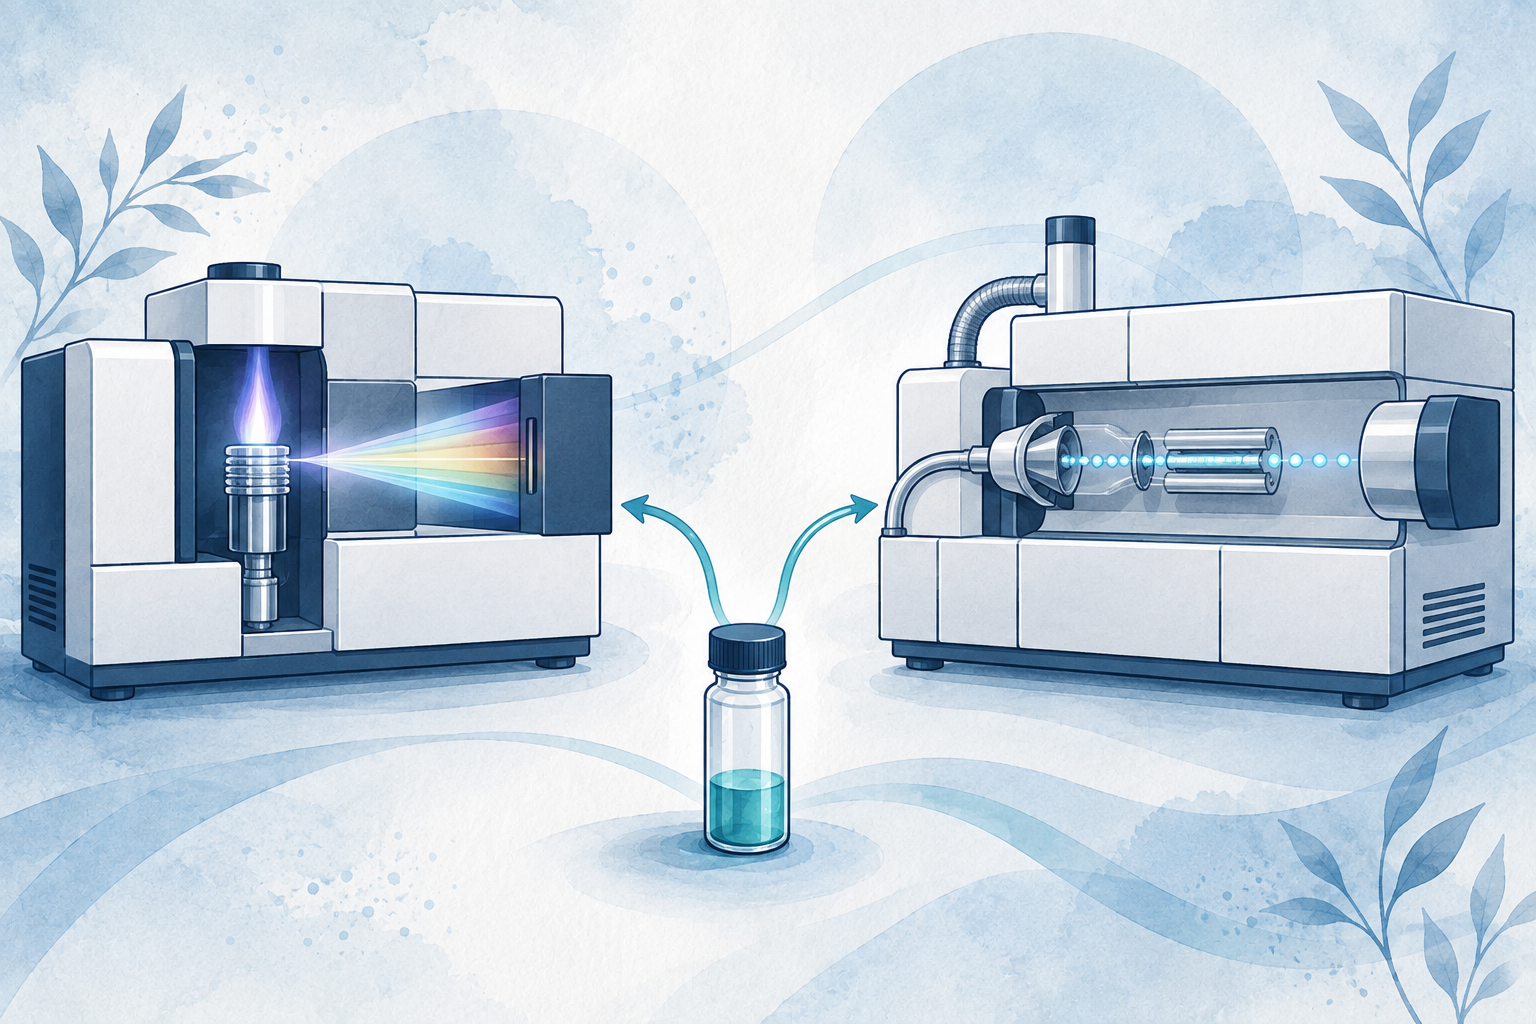
Inductively coupled plasma mass spectrometry (ICP-MS) separates ions by mass-to-charge ratio. Inductively coupled plasma optical emission spectrometry (ICP-OES) measures light at wavelengths characteristic of the elements. Both techniques can measure multiple elements. They differ in the concentration ranges they can cover and in the interferences that must be checked.
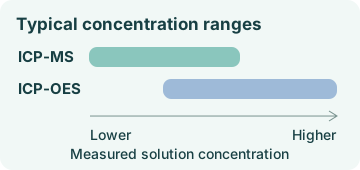
ICP-MS is often a candidate for trace and ultratrace measurements. ICP-OES is often practical for major constituents and higher concentrations. The choice depends on the required reporting limit, the concentration after preparation, the remaining sample matrix and the work needed to maintain reliable results.
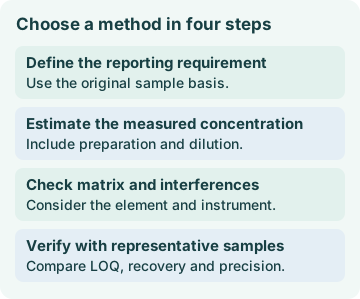
Start with the reporting requirement in the original sample
- Consider ICP-MS when the target must be quantified at very low concentrations after sample preparation and dilution.
- Consider ICP-OES when the analyte is relatively concentrated and it is desirable to avoid excessive dilution.
- When major and trace elements occur together, consider separate dilutions or separate methods.
The achievable limit of quantitation (LOQ) and working range depend on the element, matrix, blanks, preparation and instrument configuration. Verify them for the samples the method will receive.
Compare the two techniques
↔ 表が見切れている場合は、左右にスクロールしてご覧ください。↔ Scroll the table horizontally to see any hidden columns.
| Comparison | ICP-MS | ICP-OES |
|---|---|---|
| Signal | Ions formed in the plasma, separated by mass-to-charge ratio | Emission from atoms or ions, separated by wavelength |
| Typical use | Trace and ultratrace elements | Major constituents and elements at higher trace concentrations |
| Sample considerations | Matrix load after dilution, contamination and blank control | Higher-concentration constituents, sample introduction stability and adequate sensitivity |
| Spectral interference | Isobaric, polyatomic and doubly charged ions | Overlapping emission lines, background emission and stray light |
| Method settings | Isotope, internal standard, cell conditions and dilution | Wavelength, background correction positions, viewing geometry and dilution |
| Routine checks | Sample introduction, interface, vacuum and cell performance | Torch, nebulizer, wavelength selection and background correction |
Use the reporting limit to narrow the options, then check matrix load, interferences, maintenance and the likelihood of reruns. An instrument detection limit cannot stand in for a method LOQ that includes sample preparation. For the general principles, see US EPA Method 200.8 for ICP-MS, US EPA Method 200.7 for ICP emission spectrometry and Detection and Quantitation Limits.
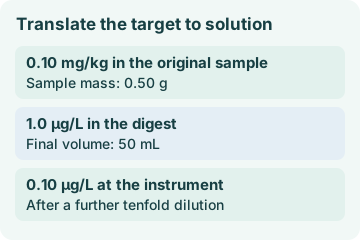
1. Work back from the sample to the measured solution
- Identify the specification, action level or reporting limit in the original sample.
- Use sample mass and final preparation volume to calculate the equivalent concentration in the digest or extract.
- Account for any additional dilution needed to reduce the matrix load.
- Evaluate whether the candidate method can quantify that concentration with the required precision.
Even a sensitive instrument may struggle if sample preparation leaves the analyte too dilute. Reducing dilution can improve the concentration presented to the instrument, but it can also increase signal suppression, spectral interference and deposits in the sample introduction path. See How to Convert ICP Results from µg/L to mg/kg.
Worked example. Suppose the reporting limit for a solid is 0.10 mg/kg. You digest 0.50 g and make it up to 50 mL. The target concentration is 1.0 µg/L in the digest. After a further tenfold dilution to reduce salt, it is 0.10 µg/L. Compare this last value with the LOQ demonstrated in the sample matrix.
2. Identify the interferences that can affect the result
ICP-MS
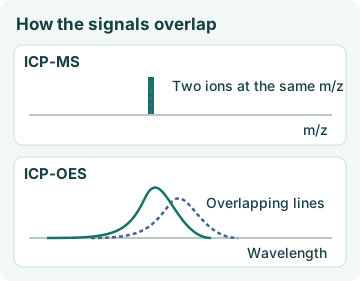
An analyte signal can share the same nominal mass-to-charge ratio (m/z) with an isotope of another element, a polyatomic ion or a doubly charged ion. Polyatomic ions can arise from argon, oxygen, chloride or carbon in the plasma or sample. High matrix concentrations can also suppress or enhance the analyte signal. Check carryover after high-concentration samples.
Options include choosing another isotope, diluting or separating the matrix, using internal standards, applying a verified interference equation, or adjusting collision or reaction cell conditions. Which controls work depends on the analyte and matrix. US EPA Method 200.8, Section 4
ICP-OES
Emission from another element near the analyte wavelength can bias the result. Also check molecular bands, continuum background and stray light from strong lines. Inspect spectra from samples or interference check solutions to select the line and background positions. Options include an alternative wavelength, interelement correction, dilution or matrix separation. Verify that the selected conditions give suitable recovery. US EPA Method 200.7, Section 4
↔ 表が見切れている場合は、左右にスクロールしてご覧ください。↔ Scroll the table horizontally to see any hidden columns.
| Observation | What to check in ICP-MS | What to check in ICP-OES |
|---|---|---|
| High concentrations of matrix constituents | Internal standard response, suppression and interface deposits | Emission intensity, background and sample introduction stability |
| A second signal near the analyte | Same-m/z ions, isotope ratios and cell conditions | Nearby lines, background positions and alternative wavelengths |
| A low-concentration sample follows a high one | Check a rinse blank for carryover | Check a rinse blank and inspect the introduction system |
3. Assess the solution going into the instrument
Record total dissolved solids, major constituents, acid identity and concentration, and any organic solvent or residual carbon. Check for suspended particles, precipitates and undigested material. Consider whether the analyte could be lost by adsorption, volatilization or precipitation. Verify that dilution to a suitable sample load still leaves enough analyte to meet the reporting limit.
Trace ICP-MS analysis is particularly sensitive to contamination from reagents, vessels and the preparation environment. A heavy matrix can also produce deposits on the interface and affect ion transmission. ICP-OES is often considered for concentrated or high-matrix solutions, but the compatible levels of salts, acids and solvents depend on the torch, nebulizer, introduction system and method conditions.
4. Compare the whole workflow
Include blanks, calibration and quality control (QC), interference checks, rinse time, carryover checks and reruns. Consider maintenance of the torch, nebulizer and spray chamber. For ICP-MS, include the interface, vacuum system and collision or reaction cell conditions. Estimate the workload for changed dilutions, gas and standard consumption, consumables and waste, as well as training, troubleshooting and records.
When both methods meet the analytical requirements, compare routine sample throughput and the effort needed to maintain valid results.
Four examples from analytical practice
↔ 表が見切れている場合は、左右にスクロールしてご覧ください。↔ Scroll the table horizontally to see any hidden columns.
| Scenario | Initial candidate | First verification |
|---|---|---|
| Very low concentrations of hazardous elements in water | ICP-MS | Reporting limit after preparation, blanks and mass interferences |
| A major constituent in a plating bath | ICP-OES | Calibration range after dilution, background and introduction-system load |
| Trace elements in a saline solution | Depends on matrix and limit; consider dilution or separation | Concentration after treatment and residual salt interference |
| Major and trace elements in the same digest | Separate aliquots and consider using both techniques | Dilution history, contamination and recovery for each aliquot |
Trace arsenic or lead in water
Convert the required reporting limit to the concentration in the measured solution. Consider ICP-MS if the requirement falls below the verified ICP-OES LOQ. For arsenic, check chloride-derived polyatomic ions along with the blank, internal standards and cell conditions. US EPA Method 200.8
Nickel as a major constituent of a plating bath
Dilute the bath into a suitable ICP-OES calibration range and verify the wavelength and background correction. Assess the load from acids, salts and surfactants before introducing the solution. Trace impurities in the same bath may need their own dilution and a different technique.
Trace elements in a saline solution
A hundredfold dilution lowers both salt and analyte concentrations by a factor of 100. Assess salt-related polyatomic ions, matrix suppression and deposits even when ICP-MS sensitivity is needed. If dilution leaves the analyte below the reporting requirement, evaluate matrix separation, preconcentration, a different sample introduction configuration or another analytical method. Check spike recovery and dilution linearity in the matrix.
Major and trace elements in one solid digest
Take separate aliquots of the digest. Use a larger dilution for major elements by ICP-OES and set the trace aliquot dilution according to the required ICP-MS sensitivity and matrix load. Record the dilution for each analyte and check contamination in the trace aliquot and calibration range in the major-element aliquot separately.
Checklist before selecting the method
- Confirm whether the applicable test method specifies a technique.
- Define the reporting limit and working range on the original sample basis.
- Calculate the expected concentration after preparation and dilution.
- Check which major constituents, acids, salts and organics remain.
- Confirm which interferences apply to the element and whether they can be managed.
- Decide whether trace and major elements need separate measurement conditions.
- Verify performance with blanks, spikes, or certified reference materials as appropriate.
- Include rinsing, maintenance, supplies and training in the operating plan.
If both techniques are permitted, compare LOQ, trueness, precision, dilution linearity, spike recovery, interferences and carryover using representative samples. Use the applicable method, instrument instructions and validation evidence to select the conditions.