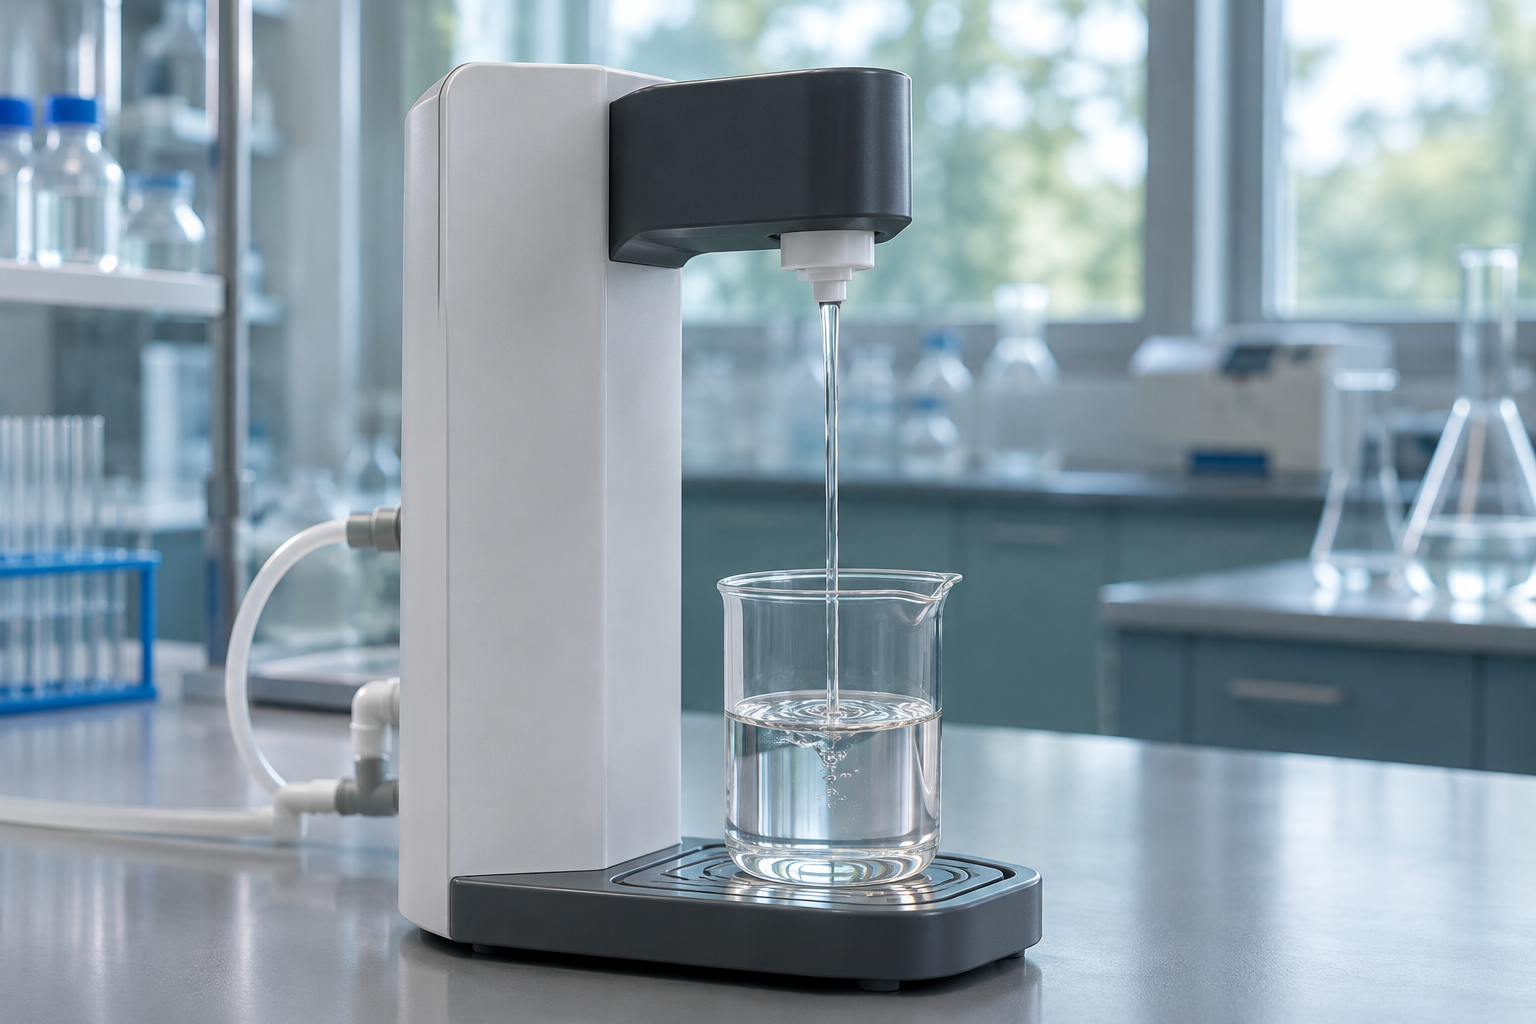
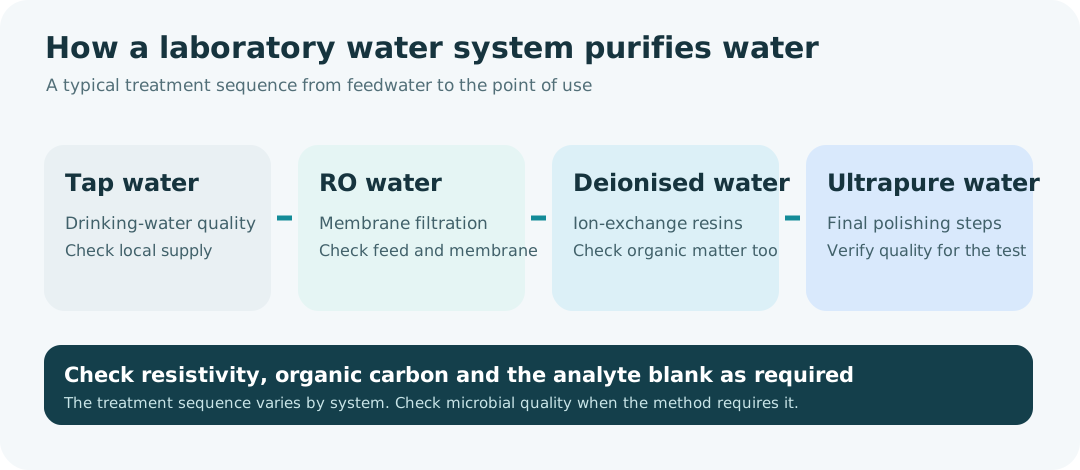
The chemical formula of purified water is H₂O. Pure and ultrapure water contain the same water molecules. Purification changes which impurities remain and how much of each is present. Reverse osmosis (RO) uses a membrane to reduce dissolved salts and other contaminants, while ion exchange mainly removes dissolved ions using resins. Ultrapure water typically undergoes several treatment steps and can reach about 18.2 MΩ·cm at 25 °C. Organo water purification overview (Japanese) · Merck water quality monitoring
Water enters an analysis through standards, dilutions, mobile phases and the final rinse of labware. For trace-level work, even a small concentration in the water can contribute appreciably to the reported result.
What are the different types of laboratory water?
↔ 表が見切れている場合は、左右にスクロールしてご覧ください。↔ Scroll the table horizontally to see any hidden columns.
| Water type | How it is produced or defined | What to check before use |
|---|---|---|
| Tap water | Treated and supplied to meet local drinking-water requirements | Dissolved salts, disinfectants and trace metals can vary with supply and plumbing. Consider it for initial washing where the procedure permits. |
| Reverse osmosis (RO) water | A membrane under pressure reduces dissolved salts and many other contaminants | Quality depends on feedwater, membrane condition and operating conditions. Check the actual outlet quality before using RO water for analysis or a final rinse. |
| Deionised water (DI water) | Ion-exchange resins remove cations and anions | Check the outlet conductivity and resin condition. Check organic matter, particles and microbial quality separately as required. |
| Distilled water | Water is evaporated and condensed, leaving many nonvolatile impurities behind | Volatile substances can carry over. Check the still, collection vessel and storage conditions. |
| Pure water | A general term used for water treated by processes such as RO or ion exchange | Ask which specification applies and verify the relevant test results. |
| Purified water | A general term that also denotes a defined grade in documents such as the Japanese Pharmacopoeia | Check the exact grade and its specifications. For trace analysis, verify the blank under your own method conditions. |
| Ultrapure water | Usually produced by combining primary purification with additional polishing steps | Around 18.2 MΩ·cm at 25 °C is a typical resistivity target. Verify organic carbon, particles, microbial quality or analyte blanks as needed. |
A common system uses RO followed by ion exchange and final polishing. Different outlets on the same system can supply different grades. Record the outlet used to prepare standards and samples. Organo water purification overview (Japanese) · Japanese Pharmacopoeia (Japanese)
Can you use RO water in place of purified water?
RO water is named for the process used to produce it. Purified water can be a general term, or a defined grade such as Purified Water in the Japanese Pharmacopoeia. A purification system can use RO as one of its steps. For example, RO water may be suitable for an intermediate labware rinse if it meets the procedure’s requirements. If the procedure specifies the Japanese Pharmacopoeia grade, check the product label or certificate of analysis for compliance with that specification. Japanese Pharmacopoeia (Japanese) · Merck laboratory water purification techniques
How does deionised water differ from ultrapure water?
Ion exchange removes dissolved ions such as calcium and chloride. An ultrapure water system can combine ion exchange with other treatments, such as ultraviolet oxidation to reduce organic matter and filtration to remove particles. For trace organic analysis, check conductivity alongside total organic carbon (TOC) and the blank under the actual method conditions. For trace metal analysis, check the blank for the specific elements you intend to report. Merck laboratory water purification techniques
Which laboratory water standard should you use?
Start with the procedure that governs the result. When it names a standard or specifies a maximum blank, record the applicable edition and acceptance criteria. Similar grade names can have different limits and test conditions.
↔ 表が見切れている場合は、左右にスクロールしてご覧ください。↔ Scroll the table horizontally to see any hidden columns.
| Standard or specification | What it covers | How to apply it |
|---|---|---|
| ISO 3696 | Three grades of water for inorganic chemical analysis | Its scope excludes trace organic, surfactant, biological and medical analysis. Check separate requirements for those uses. |
| ASTM D1193 | Four reagent-water types, I to IV | Match the type and edition cited by your method. Check any specified microbial criteria. |
| JIS K 0557 | Water used in testing industrial water and wastewater in Japan | Check the specified grade and criteria in the applicable Japanese test procedure. |
| Japanese Pharmacopoeia | Compendial specifications for pharmaceutical water, including Purified Water | Select the applicable monograph. Verify any additional requirements imposed by your analytical procedure. |
| Method-specific specification | Requirements for a particular assay, including water quality and blank acceptance | For example, US Environmental Protection Agency (EPA) Method 200.8 specifies ASTM Type I reagent water. Check the method’s referenced edition and its blank requirements. |
ISO 3696 · ASTM D1193 · JIS K 0557 (Japanese) · EPA Method 200.8
RO water conductivity and ultrapure water resistivity
Conductivity increases as more conductive ions are present. Resistivity is its reciprocal. With conductivity in µS/cm and resistivity in MΩ·cm, the numerical conversion is simple:
Conductivity (µS/cm) = 1 ÷ resistivity (MΩ·cm)
For ultrapure water, 1 ÷ 18.2 ≈ 0.055 µS/cm at 25 °C. Some meters display millisiemens per metre (mS/m). Since 1 µS/cm = 0.1 mS/m, a reading of 3 µS/cm is 0.30 mS/m, and 0.055 µS/cm is 0.0055 mS/m. Use the same temperature basis for comparisons. Water exposed to air can absorb carbon dioxide and develop higher conductivity after dispensing. Containers can also introduce contaminants. Record the sampling point, operating state and temperature basis for each reading. Merck water quality monitoring
RO example. If feedwater reads 200 µS/cm and the RO outlet reads 3 µS/cm at the same reference temperature, conductivity has decreased by (200 − 3) ÷ 200 × 100 = 98.5%. This describes the change in conductivity. To establish removal of a particular metal or organic compound, measure that compound in the feed and outlet water. Merck laboratory water purification guide (Japanese)
What if the outlet rises from 3 to 6 µS/cm? If the feed remains at 200 µS/cm, the reduction falls from 98.5% to 97.0%. First check the temperature basis, sensor condition and sampling point. If the rise persists under comparable conditions, inspect the operating conditions and membrane. If feedwater conductivity also increases, record both the outlet reading and the percentage reduction to help interpret the change.
↔ 表が見切れている場合は、左右にスクロールしてご覧ください。↔ Scroll the table horizontally to see any hidden columns.
| Indicator | What it helps you assess | Additional check |
|---|---|---|
| Conductivity or resistivity | Dissolved ions and changes in purification performance | Measure individual ions or metals when they set the reporting limit. |
| TOC | Overall organic carbon burden | Run a method blank to look for particular compounds or chromatographic signals. |
| Particle count | Particles that can contribute to flow-path or column problems | Check the water after dispensing and assess filters and containers. |
| Viable microbial count | Microorganisms that grow under the chosen test conditions | Check endotoxins separately when the procedure specifies them. |
| Analyte-specific blank | Background for the analyte under the intended measurement conditions | Compare with a full method blank to check contributions from reagents, vessels and handling. |
How water quality affects different analytical methods
Instrument performance depends on which impurities matter to the measurement. Compare blanks under the same instrumental conditions when changing water grades, outlets or suppliers.
↔ 表が見切れている場合は、左右にスクロールしてご覧ください。↔ Scroll the table horizontally to see any hidden columns.
| Application | Typical symptoms | What to check |
|---|---|---|
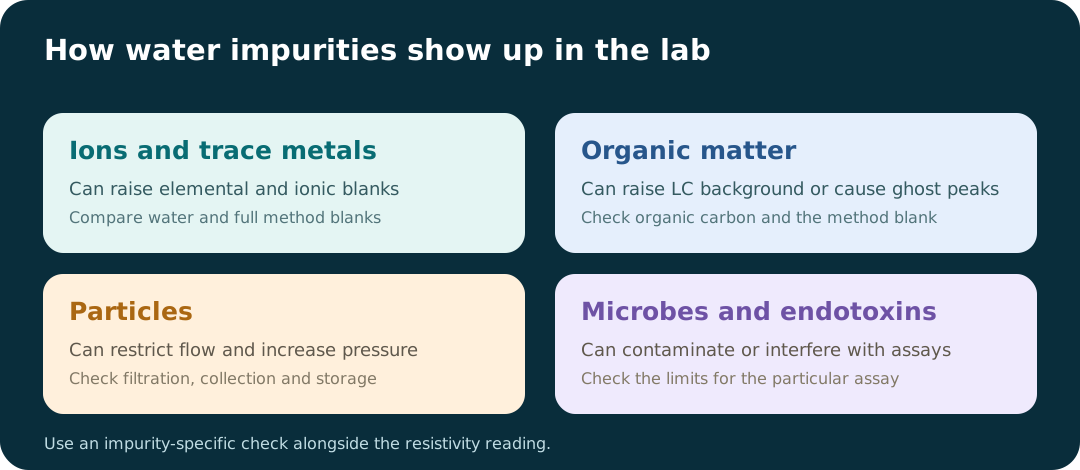
| Inductively coupled plasma mass spectrometry (ICP-MS) and inductively coupled plasma optical emission spectrometry (ICP-OES) | Higher metal blanks or variable results near the reporting limit | Compare compatible water-based solutions and blanks prepared with the same acid concentration as the samples. Include the full preparation procedure. |
| High-performance liquid chromatography (HPLC) and liquid chromatography–mass spectrometry (LC–MS) | Ghost peaks, higher background, gradient drift or ion suppression | Run a blank with the intended mobile phase and gradient. Compare water batches and check additives, bottles and the rest of the flow path. |
| Ion chromatography (IC) | Peaks from ions in the water, eluent or sample diluent | Check the ions relevant to your method, such as chloride, nitrate and sulfate. Include a preparation blank where appropriate. |
| Ultraviolet–visible (UV–Vis) and fluorescence spectroscopy | Blank absorbance or fluorescence rises near the measurement wavelength | Measure the blank at the same wavelength and with the same cuvette and reagent conditions. |
| Microbiological and biochemical tests | Contamination or changes in assay response | Check the specified limits for viable microorganisms, endotoxins or other relevant impurities. |
Water suitable for chromatography should still be checked against the metal limits needed for elemental analysis. Likewise, low trace-metal levels leave open the question of chromatographic background. To find the source of an elevated blank, compare freshly dispensed water where the instrument permits, an acidified water blank prepared at the routine acid concentration, and a full method blank taken through all preparation steps without sample. Use compatible measurement conditions for each comparison. EPA Method 6020B, quality control and blanks
Worked example: how much can a water blank add to the result?
Suppose you digest 0.100 g of solid and make the solution up to 50.0 mL. Assume contamination contributes 1.0 µg/L of lead to the final solution and there is no further dilution. The apparent lead concentration attributable to this blank is:
1.0 µg/L × 0.0500 L = 0.050 µg of lead
0.050 µg ÷ 0.000100 kg = 500 µg/kg = 0.50 mg/kg
Work backwards from an acceptable blank to set a practical target. If the blank may contribute at most 0.10 mg/kg, that is 100 µg/kg × 0.000100 kg = 0.010 µg of lead. Dividing by 0.0500 L gives 0.20 µg/L in the final solution. That allowance covers the combined contributions from water, acid, labware and the preparation process. A measured concentration in the feedwater can be converted using the actual water volume added and the final solution volume.
ICP sample concentration calculator (Japanese)
How to choose water for washing and rinsing labware
- Remove the residue. Choose a detergent, acid or solvent compatible with the labware material and the assay. Follow the validated cleaning procedure where one applies.
- Rinse away the cleaning agent. RO or DI water can be suitable for intermediate rinses where the procedure permits. Check that detergent, acid or solvent carryover is controlled.
- Use method-appropriate water for the final rinse. For an aqueous method, the water used to prepare standards and samples is a practical starting point. Use the grade and rinse procedure specified by your method. Drops left on a flask or cap can contribute to the blank.
- Protect the clean surfaces. Use clean caps or covers and an appropriate drying and storage area. Avoid touching the inside of vessels or caps.
- Check the result. If contamination persists, analyse the final rinse and run a full method blank. Confirm rinse frequency and volume against the blank criterion for your own method.
Trace-metal work may need dedicated containers and a cleaning procedure checked with a method blank. For volumetric flasks and other calibrated labware, also check material compatibility and any drying restrictions. Volumetric labware selection and care
What changes after water is dispensed?
Take water from the appropriate outlet close to the time of use, particularly for trace work. If you need to store it, use a clean, closed container whose material is suitable for the target analytes. Water can pick up substances leached from a container, while some analytes can adsorb to its walls. Air exposure, particles and microbial growth can also change quality. Establish the storage time with checks that matter to the method.
For a distribution system, record the outlet, collection time and conductivity or resistivity. Check performance trends and relevant blanks after maintenance, cartridge changes or prolonged inactivity. If the system supplies more than one bench, check the outlet where the water is actually used.
Frequently asked questions
Is RO water the same as deionised water?
RO uses a membrane to reduce a broad range of dissolved substances. Ion exchange specifically removes charged ions using resins. The two processes are often used together. Select water by the measured quality at the outlet.
What is the difference between pure water and purified water?
Pure water is a general name for water with reduced impurities. Purified water may have a similar everyday meaning or refer to a defined grade identified on the label. Check the applicable specification and the test result that matters to your use.
Can I use bottled purified water for chemical analysis?
Check the label, the applicable standard and any lot-specific certificate. If the method allows it, qualify the water with the relevant blanks. For trace determinations, check concentrations near the planned reporting limit.
Is ultrapure water sterile?
Resistivity measures electrical properties. For applications that require sterility, a microbial count limit or an endotoxin limit, check the corresponding requirement at the point of use.
Where should I start when the blank is too high?
Compare fresh water, reagent blanks and a full method blank, then see where the signal increases. Test the sample and standard containers, caps, rinse steps and reagents individually if the source remains unclear. For LC, a no-injection run under the normal gradient can help separate mobile-phase and flow-path background from injection-related effects.