
In a proton nuclear magnetic resonance (¹H NMR) spectrum recorded in chloroform-d (CDCl₃), residual chloroform appears at 7.26 ppm and water is typically near 1.56 ppm. Dichloromethane (CH₂Cl₂) carried over from extraction can appear as a singlet near 5.30 ppm. In a carbon-13 (¹³C) NMR spectrum, the CDCl₃ solvent signal is usually a triplet centred at 77.16 ppm. Fulmer et al., Tables S1 and S2
Use the tables below to look up solvent and water signals. If you have an unassigned peak, choose the observed nucleus and acquisition solvent in the searchable tool. It covers nine of the solvents listed here. NMR solvent, water and impurity peak lookup (Japanese)
Three types of signal to check first
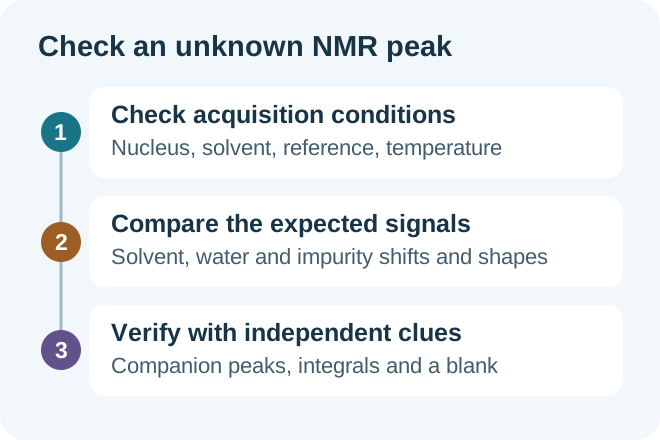
- ¹H residual solvent signal. Even a deuterated solvent contains small amounts of isotopologues that retain hydrogen. In CDCl₃, residual CHCl₃ gives the familiar 7.26 ppm signal.
- ¹³C solvent signal. This comes from the carbon in the deuterated solvent itself. The carbon of CDCl₃ couples to deuterium, so the centre of its triplet is the value listed in the table.
- Water and other impurity signals. Water shifts with the solvent and sample conditions. Extraction, purification and cleaning solvents can be carried into the tube. Any of these signals can overlap the sample.
The chemical-shift axis conventionally runs from higher ppm on the left to lower ppm on the right. The tables give peak positions or multiplet centres. Peak intensities and integrals must be read from the measured spectrum.
¹H, ¹³C and water shifts for 17 deuterated solvents
All shifts are in parts per million (ppm). The ¹H column lists residual solvent signals and the ¹³C column lists the solvent’s carbon signals. In heavy water (D₂O), HOD is water with one protium atom and one deuterium atom.
Twelve solvents from Fulmer et al. at 298 K
↔ 表が見切れている場合は、左右にスクロールしてご覧ください。↔ Scroll the table horizontally to see any hidden columns.
| Acquisition solvent | Residual solvent ¹H | Solvent ¹³C | Water ¹H |
|---|---|---|---|
| Chloroform-d (CDCl₃) | 7.26 | 77.16 | 1.56 |
| Dimethyl sulfoxide-d₆ (DMSO-d₆) | 2.50 | 39.52 | 3.33 |
| Methanol-d₄ (CD₃OD) | 3.31 | 49.00 | 4.87 |
| Acetone-d₆ | 2.05 | 29.84, 206.26 | 2.84 |
| Acetonitrile-d₃ (CD₃CN) | 1.94 | 1.32, 118.26 | 2.13 |
| Benzene-d₆ (C₆D₆) | 7.16 | 128.06 | 0.40 |
| Toluene-d₈ | 2.08, 6.97, 7.01, 7.09 | 20.43, 125.13, 127.96, 128.87, 137.48 | 0.43 |
| Chlorobenzene-d₅ (C₆D₅Cl) | 6.96, 6.99, 7.14 | 125.96, 128.25, 129.26, 134.19 | 1.03 |
| Dichloromethane-d₂ (CD₂Cl₂) | 5.32 | 53.84 | 1.52 |
| Tetrahydrofuran-d₈ (THF-d₈) | 1.72, 3.58 | 25.31, 67.21 | 2.46 |
| 2,2,2-Trifluoroethanol-d₃ (TFE-d₃) | 3.88, 5.02 | 61.50, 126.28 | 3.66 |
| Heavy water (D₂O) | 4.79 (HOD) | None | 4.79 (HOD) |
The values are from the authors’ supporting information. Fulmer et al., Tables S1 and S2
Five additional solvents from the University of Southampton
The university’s NMR facility cites Bruker’s 2009 reference data. Acquisition and referencing conditions can differ from Fulmer et al., so small differences between the tables do not directly establish a shift under identical conditions. University of Southampton solvent reference table
↔ 表が見切れている場合は、左右にスクロールしてご覧ください。↔ Scroll the table horizontally to see any hidden columns.
| Acquisition solvent | Residual solvent ¹H | Solvent ¹³C | Water ¹H |
|---|---|---|---|
| Diethyl ether-d₁₀ | 1.07, 3.34 | 14.5, 65.3 | 3.45 |
| N,N-Dimethylformamide-d₇ (DMF-d₇) | 2.75, 2.92, 8.03 | 29.76, 34.89, 163.15 | 5.2 |
| Nitromethane-d₃ | 4.33 | 62.8 | 2.2 |
| Ethanol-d₆ | 1.11, 3.56, 5.29 | 17.31, 56.96 | 4.86 |
| Pyridine-d₅ | 7.22, 7.58, 8.74 | 123.87, 135.91, 150.35 | 2.42 |
Water varies across solvents. The ¹H water signal is near 0.40 ppm in benzene-d₆, 3.33 ppm in DMSO-d₆ and 4.87 ppm in CD₃OD. Fulmer et al. also reported HOD at 2.81 ppm in acetone-d₆ and 3.30 ppm in DMSO-d₆. Whether the water isotopologues give distinct signals depends on the exchange conditions. Fulmer et al., Table S1 and its notes
Water in D₂O. The two 4.79 ppm entries refer to the same HOD signal at 298 K, about 25 °C. Its position changes with temperature. D₂O has no carbon signal. Gottlieb et al., Figure 1
Check multiplicity as well as position. Carbon–deuterium coupling normally gives a triplet for the CDCl₃ solvent signal and a septet for the DMSO-d₆ solvent signal, including in routine proton-decoupled ¹³C spectra. Acquisition conditions and resolution affect the observed lines.
Dichloromethane, tetrahydrofuran and other carryover solvents
Choose reference values for the solvent in which you recorded the spectrum. CH₂Cl₂ in CDCl₃ gives a ¹H singlet at 5.30 ppm and a ¹³C signal at 53.52 ppm. If your acquisition solvent is CD₂Cl₂, the residual ¹H signal is at 5.32 ppm, the solvent ¹³C signal is at 53.84 ppm, and water is near 1.52 ppm. The acquisition solvent recorded with the spectrum tells you which values to use. Fulmer et al., Tables S1 and S2
↔ 表が見切れている場合は、左右にスクロールしてご覧ください。↔ Scroll the table horizontally to see any hidden columns.
| Carryover solvent | ¹H in CDCl₃ (ppm) | ¹H in DMSO-d₆ (ppm) | What to look for |
|---|---|---|---|
| Dichloromethane (CH₂Cl₂) | 5.30 | 5.76 | Singlet in both solvents. The ¹³C signal in CDCl₃ is at 53.52 ppm |
| Tetrahydrofuran (THF) | 3.76, 1.85 | 3.60, 1.76 | Two methylene multiplets. The group next to oxygen appears at higher ppm |
| Ethyl acetate | 4.12, 2.05, 1.26 | 4.03, 1.99, 1.17 | Look for the quartet, singlet and triplet together |
| Toluene | 2.36, 7.17, 7.25 | 2.30, 7.18, 7.25 | Check the methyl singlet if the aromatic signals overlap |
| Acetonitrile (CH₃CN) | 2.10 | 2.07 | Methyl singlet. Other components can also give signals near 2 ppm |
These are literature values at 298 K. For example, THF carried into a CDCl₃ sample is expected at 3.76 and 1.85 ppm. When THF-d₈ is the acquisition solvent, look for its residual signals at 3.58 and 1.72 ppm. Fulmer et al., Table S1
Worked example: reading a ¹H spectrum in CDCl₃
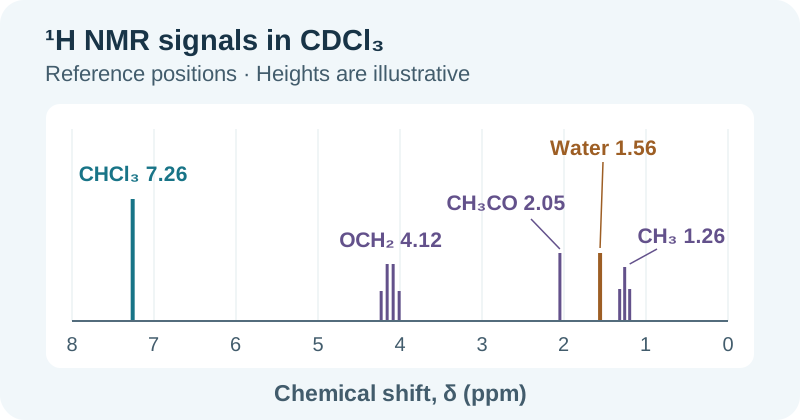
- Verify the acquisition solvent. In CDCl₃, check 7.26 ppm for residual CHCl₃. It may also be the signal used to reference the spectrum.
- Look for water near 1.56 ppm. Hydrogen bonding and sample composition can move the signal away from the literature value.
- Look for companion signals. For ethyl acetate, look for a quartet near 4.12 ppm, a singlet near 2.05 ppm and a triplet near 1.26 ppm. Overlap can make the integrals unreliable.
- Review the preparation. Check whether ethyl acetate was used in extraction, chromatography or recrystallisation and whether the sample structure predicts signals in the same region.
Toluene illustrates why the solvent region still deserves attention. Its aromatic signals can overlap or sit near the residual CHCl₃ signal. A methyl singlet near 2.36 ppm provides an additional check. The diagram shows positions only. Line heights and schematic multiplet spacing do not represent measured intensity, integration or coupling constants.
Where is the water peak, and why does it move?
Common starting points are 1.56 ppm in CDCl₃, 3.33 ppm in DMSO-d₆ and 4.87 ppm in CD₃OD. Hydrogen bonding and proton exchange affect the chemical shift and linewidth. Temperature, water content and acidic or basic sample components can change them even in the same solvent. Exchangeable O–H and N–H signals from the sample can also appear nearby. Fulmer et al., Table S1
- Verify the reference and acquisition conditions. Check the solvent and nucleus. If established peaks all move together, review the chemical-shift reference.
- Run a solvent blank. Use the same solvent lot in a clean tube at the same temperature and with the same acquisition settings. Adding the sample can move or broaden the water signal, so the blank and sample can differ.
- Check overlap before integrating. If water and a sample signal are unresolved, look for another sample peak to integrate. Where compatible with the sample, consider drying and preparing it again or measuring it in another deuterated solvent.
For example, a broad signal near 3.3 ppm in DMSO-d₆ may include water and a sample resonance. Use the blank to check whether the solvent contains water, then use a resolved companion signal to support the sample assignment.
What to do when several candidates match one ppm value
The peak lookup tool returns literature signals within a selected window. Before narrowing that window, check the chemical-shift reference, observed nucleus and acquisition solvent. NMR peak lookup (Japanese)
↔ 表が見切れている場合は、左右にスクロールしてご覧ください。↔ Scroll the table horizontally to see any hidden columns.
| Check | What it tells you | Limitation |
|---|---|---|
| Chemical shift and multiplicity | Whether the observed signal is consistent with the candidate | Overlap, limited resolution and exchange can change the shape |
| Companion signals | Whether the same candidate explains signals elsewhere | Sample peaks can conceal some of the expected signals |
| ¹H integration and number of ¹³C signals | Whether the overall pattern fits the compound | Exchangeable signals, overlap and acquisition conditions can affect the comparison |
| Preparation history and a blank | Whether the procedure could have introduced the compound | An impurity absent from the blank may still have entered during sample preparation |
| Repeat measurement under suitable conditions | Whether the proposed assignment holds up | Changing conditions can also change the chemical shifts |
The tool can show common impurities or all entries in its dataset. Its nine supported solvents are a subset of the 17 listed here. Use the tables for the additional eight and consider candidates outside the dataset when the observed pattern remains unexplained.
Using the reference data with Chemliora
Chemliora can estimate ¹H and ¹³C chemical shifts from a structure and overlay reference positions for solvent, water and impurity signals. The overlay is a separate guide for comparison with an experimental spectrum. Assign peaks using measured multiplicity, integration and sample history. Chemliora structure editor and NMR prediction
Frequently asked questions
Is the 7.26 ppm peak in CDCl₃ always a singlet?
Residual CHCl₃ is normally treated as a singlet in ¹H NMR. A nearby sample or impurity signal can distort the apparent shape. The CDCl₃ signal at 77.16 ppm is a different observation in the ¹³C spectrum and is normally a triplet.
Does the absence of a water peak prove the sample is dry?
Water may be below detection, obscured by another signal or broadened by exchange. Use an appropriate water measurement if you need to establish water content.
Should I count the ¹³C solvent peak as part of my sample?
Exclude the assigned solvent signal from the sample count. Check its characteristic position and splitting first. A sample resonance can still be hidden within the same region.
My peak differs from the table by 0.1 ppm. Can I still assign it?
Check the reference, temperature, concentration and sample matrix. Water and exchangeable proton shifts are especially condition dependent. Look for companion signals and confirm that the assignment fits how the sample was prepared.
References and scope
- Fulmer, G. R., et al. “NMR Chemical Shifts of Trace Impurities: Common Laboratory Solvents, Organics, and Gases in Deuterated Solvents Relevant to the Organometallic Chemist.” *Organometallics* 29 (2010), 2176–2179. Article · Supporting information
- Gottlieb, H. E., Kotlyar, V., and Nudelman, A. “NMR Chemical Shifts of Common Laboratory Solvents as Trace Impurities.” *Journal of Organic Chemistry* 62 (1997), 7512–7515. Article
- University of Southampton NMR facility. Properties of Selected Deuterated Solvents for NMR Spectroscopy