

In high-performance liquid chromatography (HPLC), a changed peak does not automatically mean the analytical column has failed. The same apparent tailing can arise from secondary interactions, an incorrect connection or a strong sample solvent. Unexpected peaks can come from carryover, the mobile phase or incomplete elution in the preceding run. A change in retention time can reflect flow, composition, temperature or insufficient equilibration.
Start by recording what changed, when it changed and in which injection. Compare a fresh standard with the sample and several kinds of blank. Examine the pressure trace and baseline alongside peak shape, area and retention time. The examples here mainly concern reversed-phase HPLC; use the system-suitability criteria in your validated method and the instructions for your specific instrument and column.
Identify the five symptoms first
↔ 表が見切れている場合は、左右にスクロールしてご覧ください。↔ Scroll the table horizontally to see any hidden columns.
| Symptom | What to observe | First comparison |
|---|---|---|
| Tailing | The back of a peak extends farther than the front; one analyte or every peak? | Fresh standard; lower injection amount and concentration separately. |
| Ghost peak | An unexpected peak; does it appear in a blank? | No-injection run, solvent blank and blanks after a concentrated sample. |
| Retention-time shift | One peak or all peaks move, and in which direction? | Consecutive standard injections, pressure, composition and temperature. |
| Baseline drift | The signal between peaks rises or falls slowly. | Repeated blanks, gradient program and temperature history. |
| Pulsation | Pressure or detector signal repeatedly rises and falls. | Align the pressure and signal traces by time. |
Record peak width, area and pressure as well as retention time. Baseline drift is a change in the signal reference level; it is different from a shift in retention time. All figures below are conceptual comparisons, not measured chromatograms or performance claims for a particular instrument.
Tailing: one compound or all peaks?
Tailing means the trailing side of a peak is wider than its leading side. A tailing factor measured at 5% peak height is one way to describe it, but the formula and acceptance limit must follow the applicable method. Peak shape alone cannot identify its cause. Waters' troubleshooting guide recommends checking whether the problem affects all peaks.
↔ 表が見切れている場合は、左右にスクロールしてご覧ください。↔ Scroll the table horizontally to see any hidden columns.
| Observation | Likely candidates | Useful test |
|---|---|---|
| Only a basic or otherwise susceptible compound tails | Secondary interaction with residual silanols, mobile-phase pH, adsorption to metal | Prepare a fresh standard and mobile phase; review permitted pH, salt, stationary phase and wetted materials. |
| All peaks broaden or distort | Poor fitting, extra-column void volume, fouled column inlet or guard column | Compare connections, pressure history and the guard column before replacing the analytical column. |
| Worse after increasing the injection | Column overload, strong sample solvent or a broad injection band | Reduce injection volume and sample concentration one at a time; compare a solvent closer to the initial mobile phase. |
| Standard is normal, but real sample is distorted | Matrix coelution, fouling or preparation effects | Compare dilution, spike recovery, suitable cleanup and blanks. |
The Shimadzu peak-shape guide also discusses extra volume in tubing. Backflushing is appropriate only when the column manufacturer's instructions permit it.
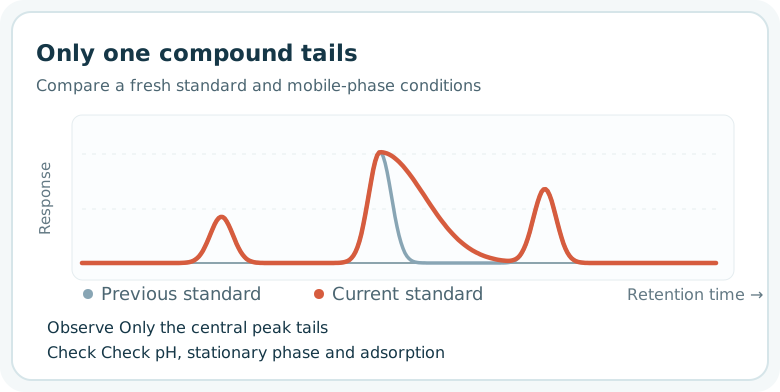
If only one compound changes, investigate its chemistry and mobile-phase conditions first. The figure suggests secondary interaction as a possibility; it does not prove silanol or metal adsorption.
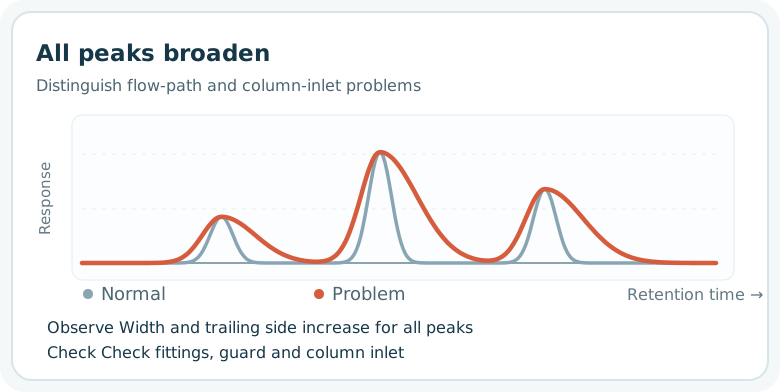
Inspect the shared flow path, guard column and column inlet. Check insertion depth and fitting compatibility when reconnecting tubing.
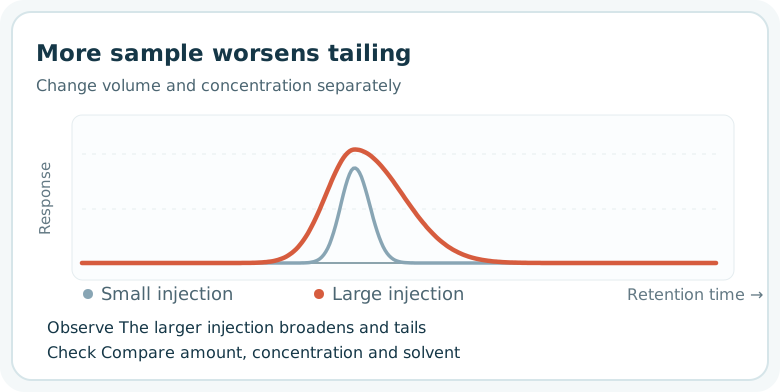
Change volume and concentration separately so that overload is not confused with a solvent effect.
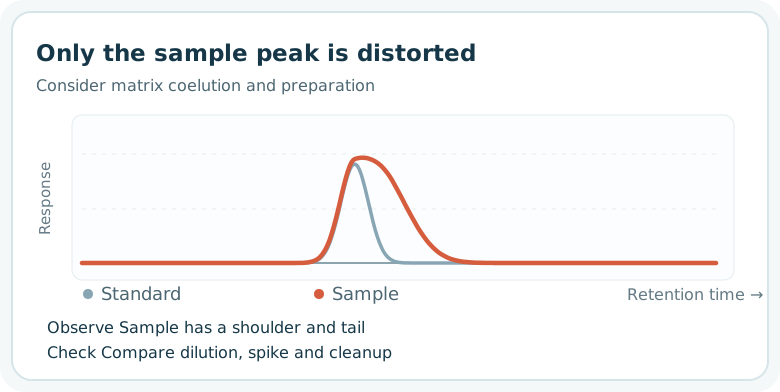
The sample matrix may coelute. A normal standard does not guarantee that the sample peak can be integrated reliably with the same settings.
Ghost peaks: in which blank do they appear?
“Ghost peak” is a practical name for a peak not expected from the intended sample. Consider carryover, contamination from the eluent or vial, material that failed to elute in the preceding run, and a signal caused by differences between the sample solvent and mobile phase. With some ultraviolet (UV) detection conditions, dissolved oxygen differences can resemble a peak; see Shimadzu's experimental example.
↔ 表が見切れている場合は、左右にスクロールしてご覧ください。↔ Scroll the table horizontally to see any hidden columns.
| Comparison | Interpretation | Next check |
|---|---|---|
| Run the gradient without an injection | A peak here points first to mobile phase, flow path or column. | Compare freshly prepared mobile phases, water, bottles and flow path. |
| Inject a solvent blank | A peak only after injection implicates vial, septum, injector or sample solvent. | Change one container, solvent or wash condition at a time. |
| Run successive blanks after a concentrated sample | A peak that diminishes suggests carryover. | Check needle, seal, loop and wash-solvent compatibility. |
| Extend the previous run | Late-eluting material may reappear in the next injection. | Review final elution strength and wash duration. |
| Compare solvent of the same composition with different degassing | A changed signal may arise from dissolved air. | Also check wavelength and solvent composition. |
For a difficult gradient problem, a useful experiment is to run the same mobile-phase program twice within one blank injection. Complete the first gradient, return to the initial conditions, equilibrate sufficiently and repeat the gradient. Look for a peak in the second cycle and compare areas. Reappearance does not, by itself, prove mobile-phase contamination: retained material on the column may elute again. Adapt Waters' procedure to the instrument and method.
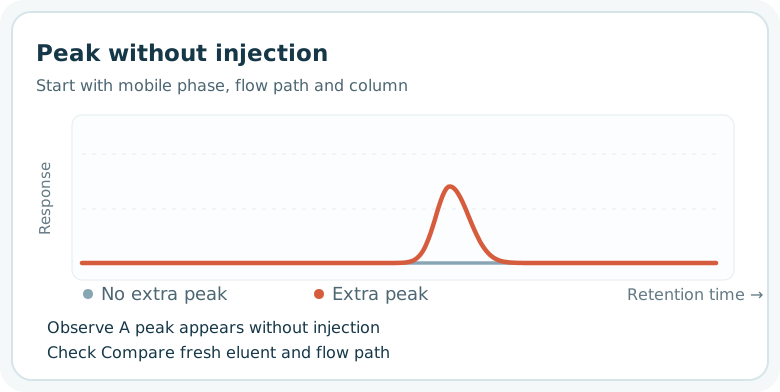
Start with the mobile phase, flow path and column rather than the sample vial.
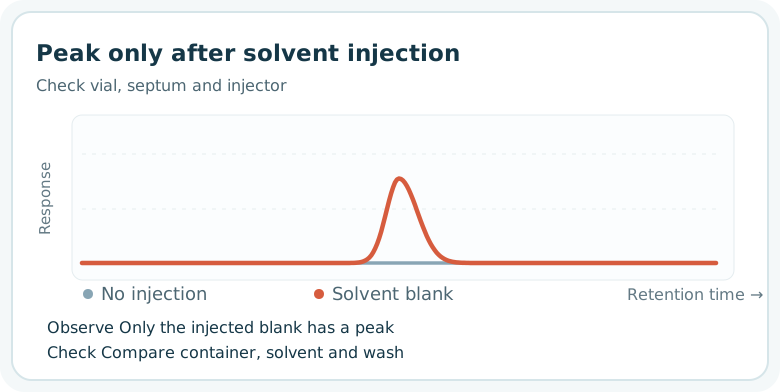
Compare a clean vial and a different solvent lot before assigning the cause.
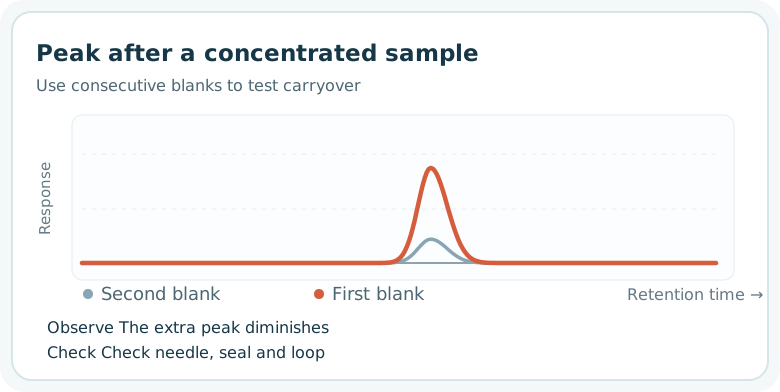
This supports carryover, but also check whether the preceding sample fully eluted.
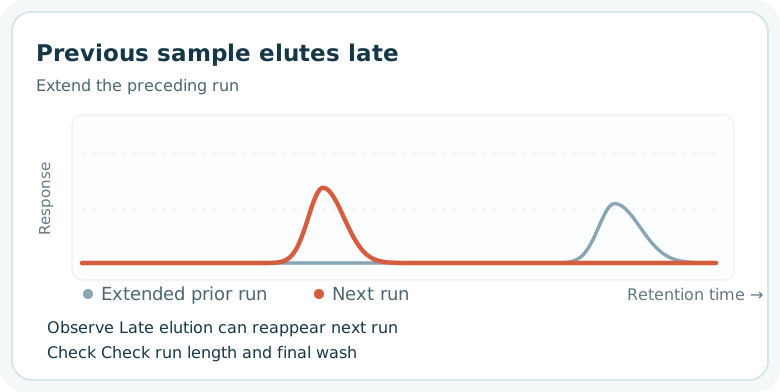
The two traces represent separate runs. Extend the preceding run to look for late components.
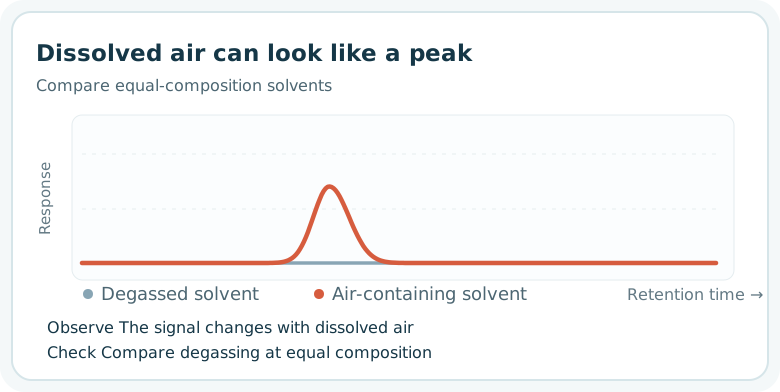
The location of this illustrative signal is not a general retention position.
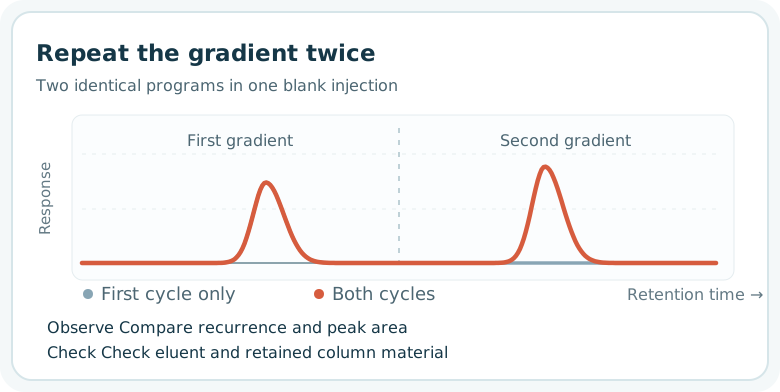
Compare the second response with the first while considering both eluent contamination and material retained on the column. Do not assign a source from peak area alone.
Retention-time shifts: all peaks or selected analytes?
When repeated injections of the same standard move, inspect mobile-phase composition, delivered flow, temperature and return to initial gradient conditions. Starting the next injection before the column has re-equilibrated can shift retention. Thermo Fisher Scientific's guide lists equilibration, pump and temperature among the causes of variable retention.
↔ 表が見切れている場合は、左右にスクロールしてご覧ください。↔ Scroll the table horizontally to see any hidden columns.
| Pattern | Candidates | First check |
|---|---|---|
| All peaks shift and pressure changes | Flow problem, leak, air or composition | Pressure trace, leaks, pump delivery and purge state. |
| All peaks shift while pressure is nearly stable | Preparation or mixing of eluent, temperature, equilibration | Fresh eluent, temperature history and initial-condition hold. |
| Only an ionic compound shifts | pH, buffer or salt concentration, stationary-phase changes | Preparation records, pH, standard and sample. |
| Only the sample shifts | Matrix, dissolution solvent or sample change | Fresh sample, dilution, spike and solvent. |
There is no universal number of minutes that defines a failure. Compare with the method's retention window, system-suitability criteria and historical control range. Verify the original conditions before changing the method merely to move the peaks back.
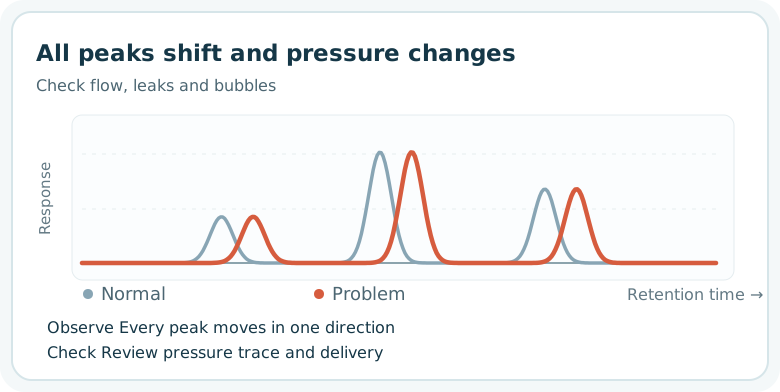
A simultaneous pressure change makes delivery worth checking, but does not prove a pump fault.
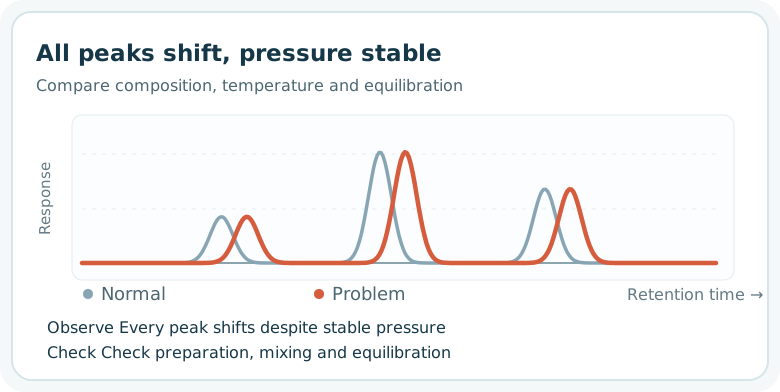
Pressure stability does not prove that eluent composition is correct. Check mixing, temperature and equilibration.
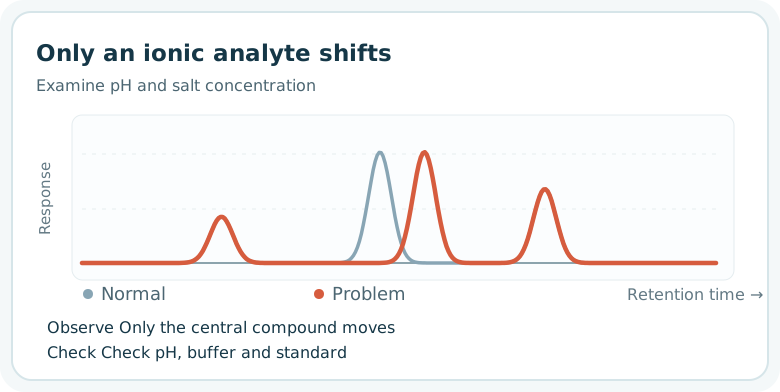
Compare mobile-phase pH and buffer. Stable other analytes help separate analyte-specific retention from an overall flow change.
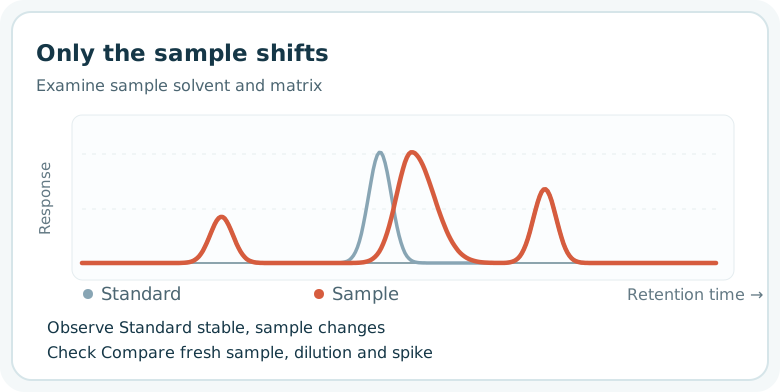
Compare freshly prepared sample, dilution and standard addition to examine matrix and sample-solvent effects.
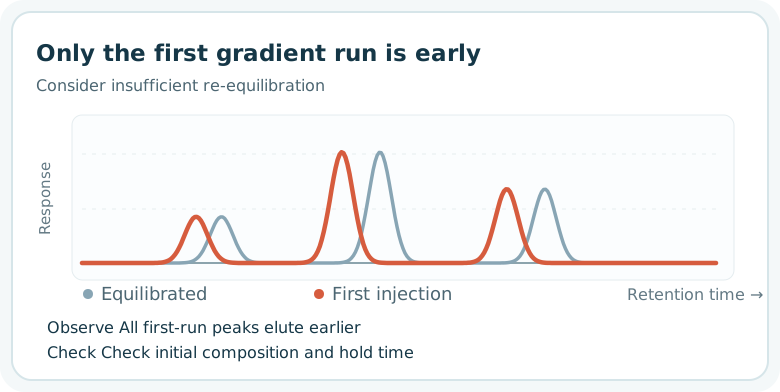
Compare the first and later standard injections after allowing enough time at the initial composition.
Baseline drift: a slowly moving reference level
Baseline drift is a gradual rise or fall between peaks. Separate it from a retention-time shift in the record. First ask whether it also appears in a blank and whether it repeats with each gradient. A reproducible gradient-related baseline change, which can depend on eluent composition and wavelength, is not automatically a malfunction. A new or growing change under previously stable conditions calls for checks of equilibration, eluent preparation and mixing, temperature and detector condition. Thermo Fisher Scientific's LC guide includes insufficient equilibration, flow-cell bubbles or contamination and solvent contamination among the possibilities.
↔ 表が見切れている場合は、左右にスクロールしてご覧ください。↔ Scroll the table horizontally to see any hidden columns.
| Pattern | First comparison | Possible hardware area |
|---|---|---|
| Large change just after starting, then settling | Consecutive blank runs and temperature/equilibration history | Column oven or detector stabilization. |
| Nearly identical shape in each gradient | Overlay blank gradients; check eluent and wavelength | Mixer, proportioning or solvent-selection valve if behavior changed. |
| Irregular signal even with stable pressure | Fresh eluent, flow cell and detector checks | Flow-cell air or contamination, lamp or electronics. |
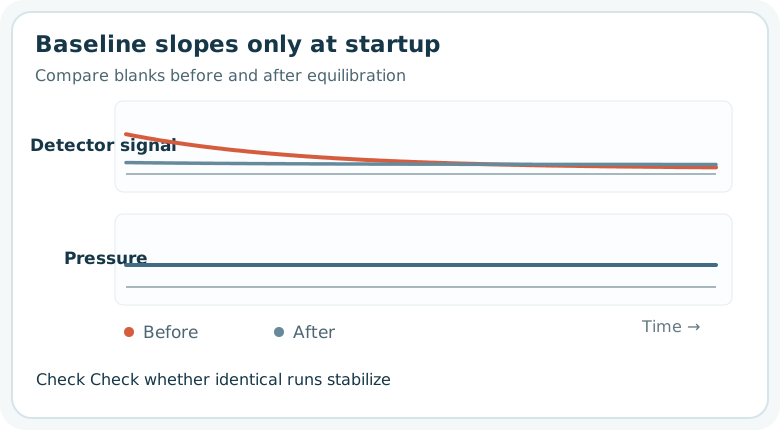
Repeat the same blank. A stable pressure trace does not rule out temperature or detector stabilization.
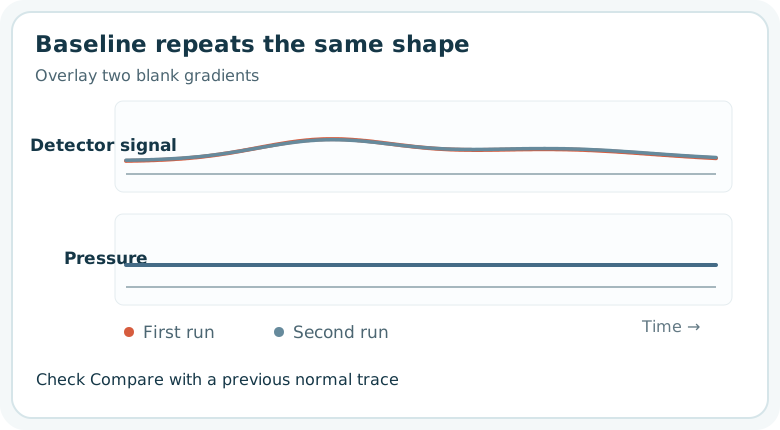
Compare with a previous normal trace. The Agilent LC Handbook identifies mixing and proportioning-valve problems among possible drift causes.
Pulsation: separate periodic delivery from irregular bubbles
A reciprocating pump has some normal pressure variation. A visible period alone is not evidence of failure. Check whether the fluctuation is larger than usual, affects integration and appears at the same time in both detector signal and pressure. Waters describes a case in which pump wear was reflected in baseline ripple.
↔ 表が見切れている場合は、左右にスクロールしてご覧ください。↔ Scroll the table horizontally to see any hidden columns.
| Observation | Candidates | Check in order |
|---|---|---|
| Pressure and detector signal fluctuate with the same period | Air in pump head, check valve, seal, pulse damper if fitted | Save both traces; check degassing and purge, then follow maintenance instructions. |
| Irregular pressure dips and signal spikes | Air entering the line, inadequate suction or leak | Check solvent level, inlet filter, leaks, degassing and purge. |
| Pressure stable but only signal has spikes | Air or contamination in flow cell, detector or electrical issue | Examine the flow cell and detector rather than assuming pump failure. |
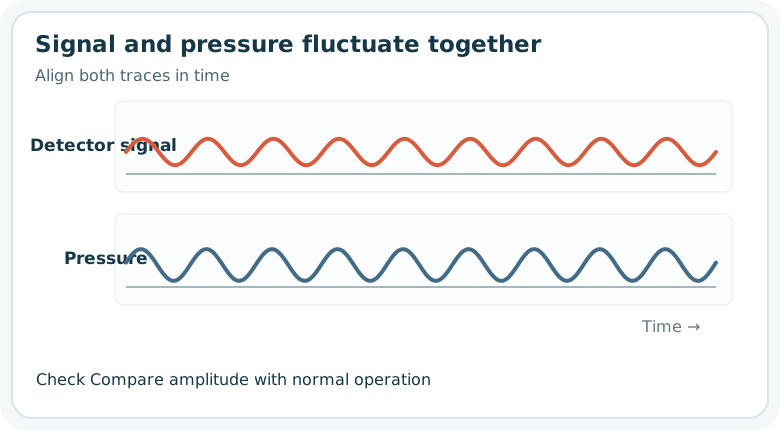
Delivery is a priority when the timing matches. If purging does not improve it, inspect check valves, seals and a fitted pulse damper according to the instrument procedure. The Thermo Fisher Scientific pump manual discusses these components.
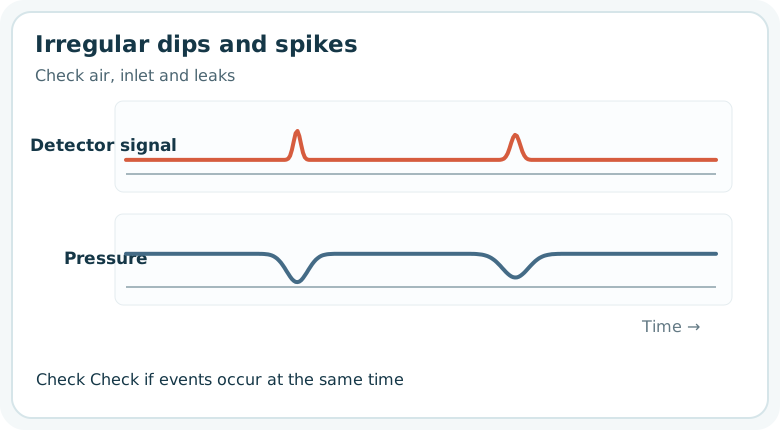
An irregular pattern can suggest bubbles or inlet-side problems. Check the solvent supply, inlet, purge and leaks first.
When to suspect hardware: align pressure and detector traces
Tubing, inline filters, guard columns, pump seals, check valves and detector flow cells create different patterns. Compare with a normal trace at the same eluent composition, flow and temperature: viscosity and temperature also affect pressure. Thermo Fisher Scientific's troubleshooting table separates high-pressure blockages from low-pressure leaks, seals and air.
↔ 表が見切れている場合は、左右にスクロールしてご覧ください。↔ Scroll the table horizontally to see any hidden columns.
| Observation | Examine first | Caution |
|---|---|---|
| Pressure gradually rises under the same conditions | Inline filter, guard column, column inlet, tubing | Review the trend; depressurize before disconnection or cleaning. |
| Pressure suddenly falls and retention or area changes | Leak, pump seal, inlet bubbles, purge valve | Check settings and delivery as well as visible leaks. |
| Pressure stable, detector signal spikes | Flow cell, trapped air, lamp or electronics | Use the detector diagnostic and cleaning procedure. |
| All peaks broaden after tubing replacement | Fitting insertion, tubing inner diameter, extra-column volume | Compare standards before and after; do not presume column degradation. |
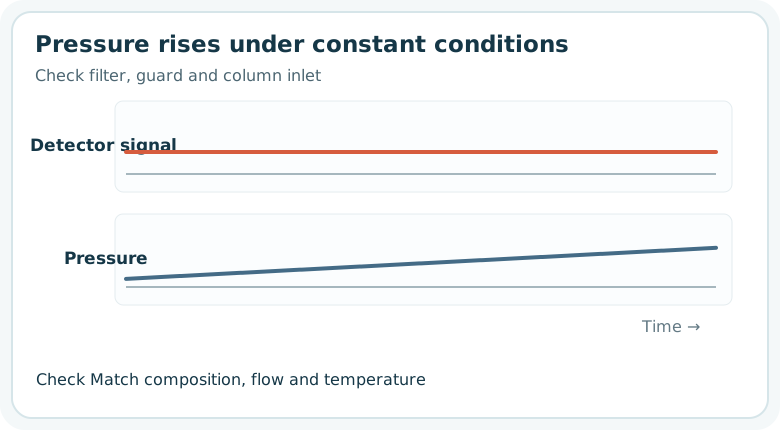
Inspect places prone to blockage in a controlled sequence, following the instrument's depressurization instructions.
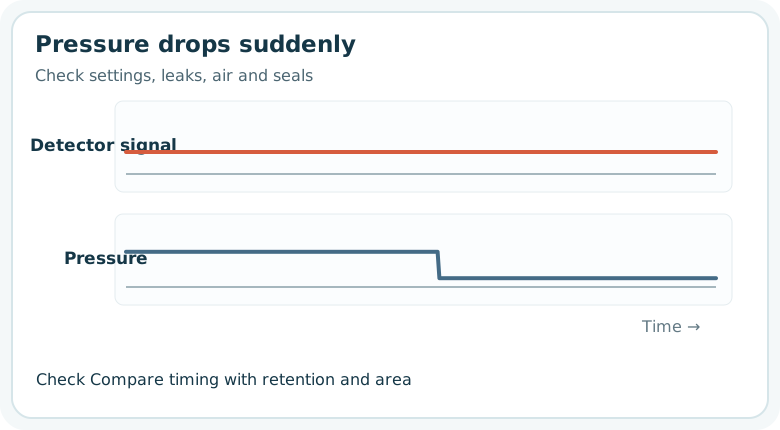
A change of set flow or eluent composition can also alter pressure. Compare the programmed and actual conditions.
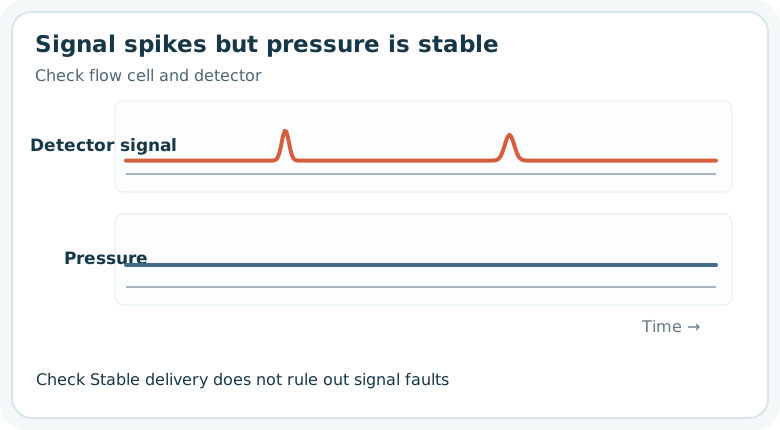
Check flow-cell bubbles or contamination and the detector diagnostics. Shimadzu's baseline guide treats pump-related ripple and flow-cell bubbles as distinct candidates.
A practical sequence for investigating a problem
- Preserve the comparison. Save normal and abnormal chromatograms, pressure traces, eluent composition and preparation date, temperature, injection volume and wash conditions.
- Find where it recurs. Test a fresh standard, real sample, no-injection run and solvent blank as appropriate.
- Review recent changes. Check eluent, vial, guard column, tubing, sample preparation and maintenance history.
- Change one factor at a time. For example, compare the same standard before and after changing a guard column. Follow equipment instructions before cleaning or disconnection.
- Confirm recovery. Check the method's limits for retention, resolution, tailing, area, blank and pressure; document the change and its effect.
↔ 表が見切れている場合は、左右にスクロールしてご覧ください。↔ Scroll the table horizontally to see any hidden columns.
| Situation | Starting point | Common premature conclusion |
|---|---|---|
| Only a basic standard compound begins tailing | Fresh standard, pH, column and wetted surfaces | Discard the analytical column immediately. |
| Blank after a concentrated sample contains the same peak | Consecutive blanks and extension of previous run | Label every peak mobile-phase contamination. |
| Only the first gradient injection is early | Initial composition, equilibration, temperature | Move integration windows without investigating. |
| Blank baseline slopes sharply at startup | Consecutive blank runs and equilibration | Replace the detector immediately. |
| Pressure and detector signal oscillate together | Pressure log, degassing, purge and pump | Smooth the signal without fixing the cause. |
| Pressure increases and peaks change | Compare at constant conditions; check filter and guard | Diagnose a blockage without checking eluent viscosity. |
| Pressure stable but detector signal spikes | Flow cell and detector diagnostics | Repeatedly service only the pump. |
Related guides
- Selecting an HPLC column — stationary phase, dimensions, guard columns and low-adsorption flow paths.
- Selecting an HPLC detector — why detector principles change what can be observed.
- Choosing chromatography vials and caps — container and septum contamination or adsorption.
- Choosing water for chemical analysis — mobile-phase water quality and unexpected peaks.
Primary troubleshooting references
- Waters, Troubleshooting Peak Shape Problems in HPLC.
- Waters, Carryover or Ghost Peaks on LC Columns.
- Shimadzu, Abnormal Peak Shapes.
- Shimadzu, Peaks from Dissolved Air in Sample Solvent.
- Thermo Fisher Scientific, Successful HPLC Operation: A Troubleshooting Guide.
- Thermo Fisher Scientific, Liquid Chromatography Troubleshooting Guides.
- Thermo Fisher Scientific, UltiMate 3000 Pump Operating Instructions.
- Shimadzu, Baseline Problems.
- Waters, Baseline Ripple with Certain Instruments.
- Agilent, LC Handbook.