
In high-performance liquid chromatography (HPLC), separating a compound on the column does not guarantee a visible peak: the detector must respond to it. Conversely, seeing a peak does not by itself establish identity or reliable quantitation at a low concentration. Choose a detector by asking what molecular property generates its signal, which matrix components may interfere, and whether the mobile phase is compatible.
This guide compares seven approaches: ultraviolet–visible absorbance (UV), photodiode-array or diode-array detection (PDA/DAD), fluorescence detection (FLD), refractive-index detection (RI), mass spectrometry (MS), evaporative light-scattering detection (ELSD) and charged-aerosol detection (CAD). It also explains why a manufacturer's sensitivity figure is not automatically the reporting limit for your sample.
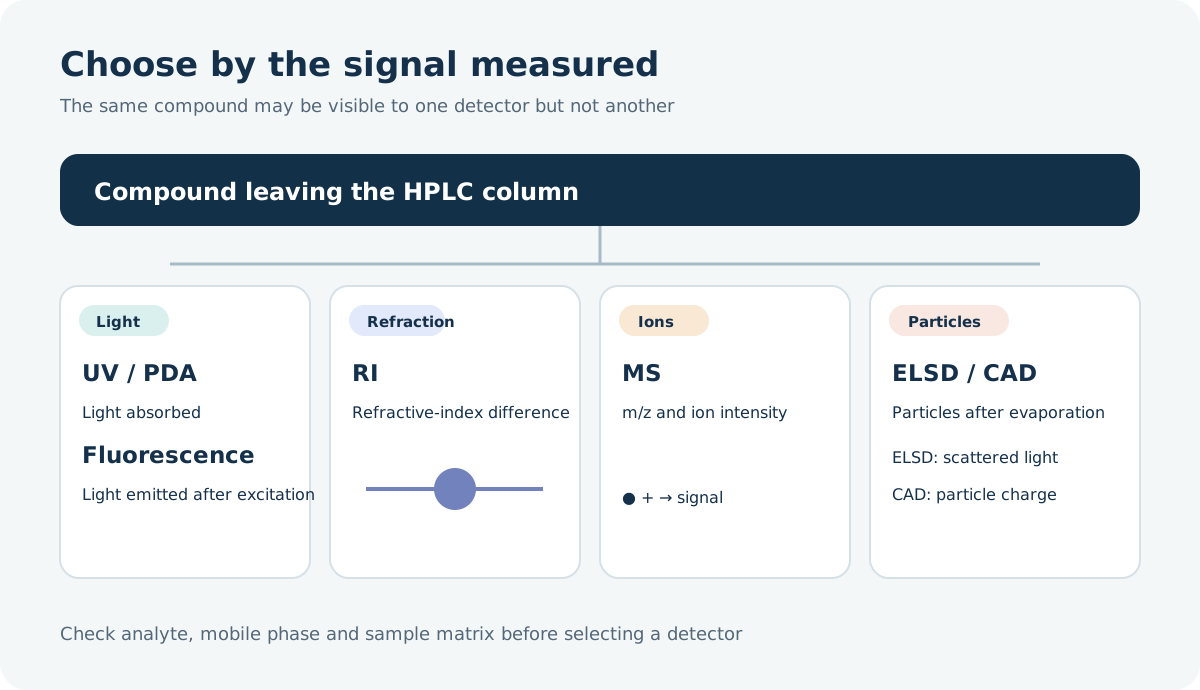
Five questions to answer before choosing
Ranking instruments by an advertised sensitivity number alone can lead to an invisible analyte, an incompatible eluent or a method that fails in the actual sample. Narrow the choices in this order:
- What is the analyte like? Does it absorb UV light, fluoresce, ionize readily or remain nonvolatile after nebulization?
- What is the analytical goal? Routine quantitation of a known compound, discovery of an unknown peak or supporting evidence for identity?
- What is the sample matrix? A relatively clean raw material, or serum or a food extract with many possible interferents?
- What reporting limit is needed? State it in the original sample and account for dilution, concentration and recovery during preparation.
- What are the chromatographic conditions? Check gradient versus isocratic elution, nonvolatile salts, flow rate and detector plumbing.
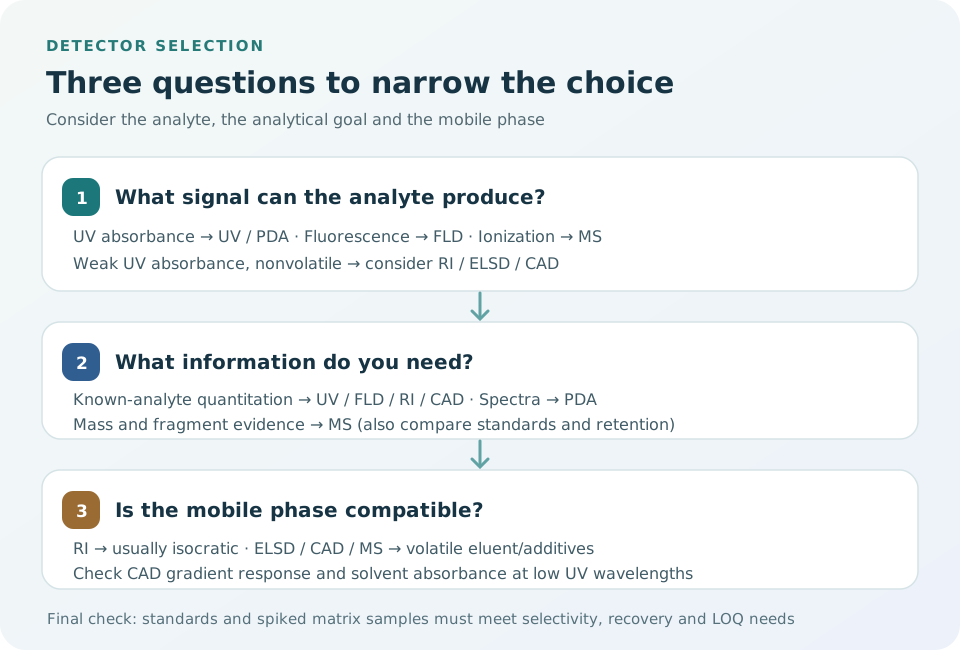
Compare the seven signal principles
↔ 表が見切れている場合は、左右にスクロールしてご覧ください。↔ Scroll the table horizontally to see any hidden columns.
| Detector | What produces the signal | Useful applications | Main limitations |
|---|---|---|---|
| UV, including a variable-wavelength detector (VWD) | Absorption at selected wavelengths | Routine quantitation of compounds with chromophores, such as aromatic or conjugated groups | Weakly absorbing analytes may be missed; solvents and additives can absorb too |
| PDA/DAD | An absorbance spectrum recorded over many wavelengths | Choosing a wavelength, comparing peak spectra and monitoring multiple components | Requires UV absorption; spectral agreement does not prove identity |
| FLD | Light emitted after excitation | Selective trace analysis of fluorescent or derivatized compounds | Nonfluorescent compounds need a suitable derivatization route; quenching and pH matter |
| RI | Refractive-index difference between eluent and sample zone | Sugars, alcohols and polymers that absorb UV weakly | Temperature-sensitive; normally used with constant-composition, isocratic elution |
| MS | Mass-to-charge ratio (m/z) and intensity of analyte-related ions | Trace components, confirmation and selective quantitation in complex samples | Ionization efficiency, matrix effects and eluent compatibility vary |
| ELSD | Light scattered by particles left after eluent evaporation | Nonvolatile or low-volatility components without a UV chromophore | Needs a volatile eluent; semivolatile analytes can be lost; response is often nonlinear |
| CAD | Charge acquired by particles left after eluent evaporation | Comparing and quantifying many nonvolatile components without a chromophore | Needs a volatile eluent; gradient composition and aerosol formation affect response |
No detector sees everything. For example, RI may work well for routine sugars with weak UV absorption. For trace sugars in a complex matrix, a validated derivatization–FLD method or suitable liquid chromatography–mass spectrometry (LC/MS) method may be more appropriate. The Thermo Fisher Scientific detector overview compares the signal principles.
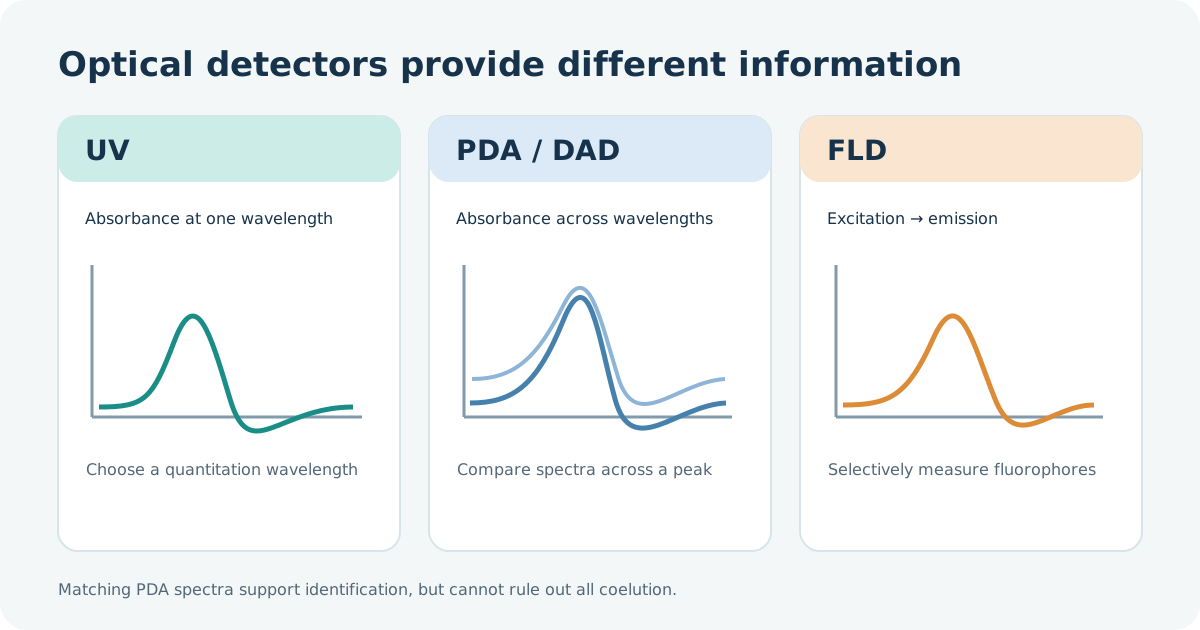
Three optical choices: UV, PDA and fluorescence
A UV detector records absorbance at a chosen wavelength as compounds elute. Start with a reference standard's spectrum and check whether the sample matrix and mobile phase interfere at that wavelength. A single-wavelength measurement is often enough for routine quantitation; some instruments can monitor several wavelengths.
PDA/DAD records absorbance across a wavelength range. It helps with wavelength selection, comparison of an unknown peak with a reference and checking whether the spectrum changes across a peak. However, coeluting compounds with similar spectra may escape a peak-purity check. Spectral agreement is supporting evidence, not proof of separation or identity; use a standard, different separation or MS when warranted. See Shimadzu's UV and PDA comparison.
An FLD combines excitation and emission wavelengths to select compounds that fluoresce. For a suitable analyte, the lower background can yield a lower method limit than UV. A nonfluorescent compound may be derivatized, but reaction yield, reagent excess and reaction time then become part of the method. Solvent, pH, temperature and quenchers can change fluorescence intensity.
Weak UV absorbers: RI, ELSD and CAD
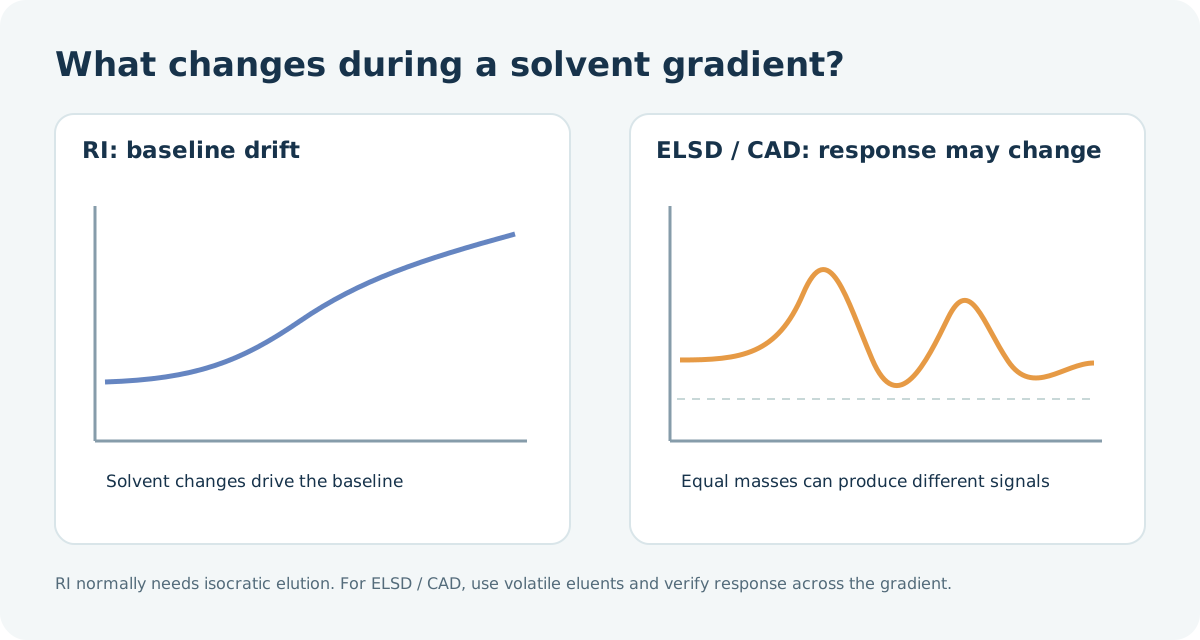
RI responds to many substances, but the refractive-index difference between eluent and sample is small. Temperature or eluent-composition changes can shift the baseline enough to hide small peaks. It is useful for compounds such as sugars that absorb UV weakly. Conventional RI detection is therefore normally run isocratically. This Waters application for sugars in fruit juice uses an isocratic method.
In ELSD and CAD, the eluent is nebulized and evaporated; particles left behind are measured by scattered light or charge, respectively. This makes them candidates for lipids, surfactants and other weak UV absorbers. If the analyte evaporates or decomposes with the mobile phase, its response can fall. Nonvolatile additives such as phosphate salts can raise background or foul the detector; select compatible volatile eluents and additives.
ELSD calibration is often nonlinear. CAD is not perfectly linear or equally responsive under every condition either. It may show less variation in response among some nonvolatile analytes than ELSD, but changing organic-solvent fraction during a gradient changes nebulization and particle formation. Equal analyte masses can give different responses at different elution times. Verify calibration across the required range and recovery with appropriate standards. See the Thermo Fisher Scientific comparison and its technical note on gradient effects.
If gradient-dependent CAD response matters, inverse-gradient compensation can add an opposing solvent gradient after the column so that the detector receives an approximately constant solvent composition. This requires an additional pump and control of flow, mixing and timing. Without a demonstrated correction, do not assume CAD can quantify different compounds with one response factor. Validate analyte-specific standards or a suitable surrogate. The principle is described in a Thermo Fisher Scientific technical note.
MS provides more than a mass reading
LC/MS ionizes eluting compounds and monitors their ions by m/z. Selected ions or fragments can distinguish analytes even when another component coelutes in a UV trace. A molecular-related ion, isotope pattern, fragments and retention time together strengthen identification. Yet isomers and other species can share an m/z: MS alone does not always give a unique structure.
Sensitivity depends strongly on ionization. Electrospray ionization (ESI) is a candidate for compounds that ionize readily in solution; atmospheric-pressure chemical ionization (APCI) can suit some less-polar compounds that tolerate the source conditions. Coextractives can suppress or enhance ionization, creating matrix effects. Volatile additives such as formic acid, acetic acid, ammonium acetate or ammonium formate are commonly considered; nonvolatile salts such as phosphate are usually avoided. Before coupling an existing UV method to MS, check flow, salts, wash solvents and any post-column split. See Shimadzu's LC/MS mobile-phase guidance.
Read detection and quantitation limits correctly
Vendor summaries sometimes place orders of magnitude such as ng for UV, fg for fluorescence, µg for RI or pg for CAD and MS side by side. These are illustrative amounts reaching a detector, often measured with different compounds and definitions of noise. They do not establish a sample reporting limit or an unconditional ranking. PDA cannot be assigned a fixed sensitivity relative to UV, and FLD is inapplicable if the compound does not fluoresce. Interpret the Thermo Fisher Scientific overview in that context.
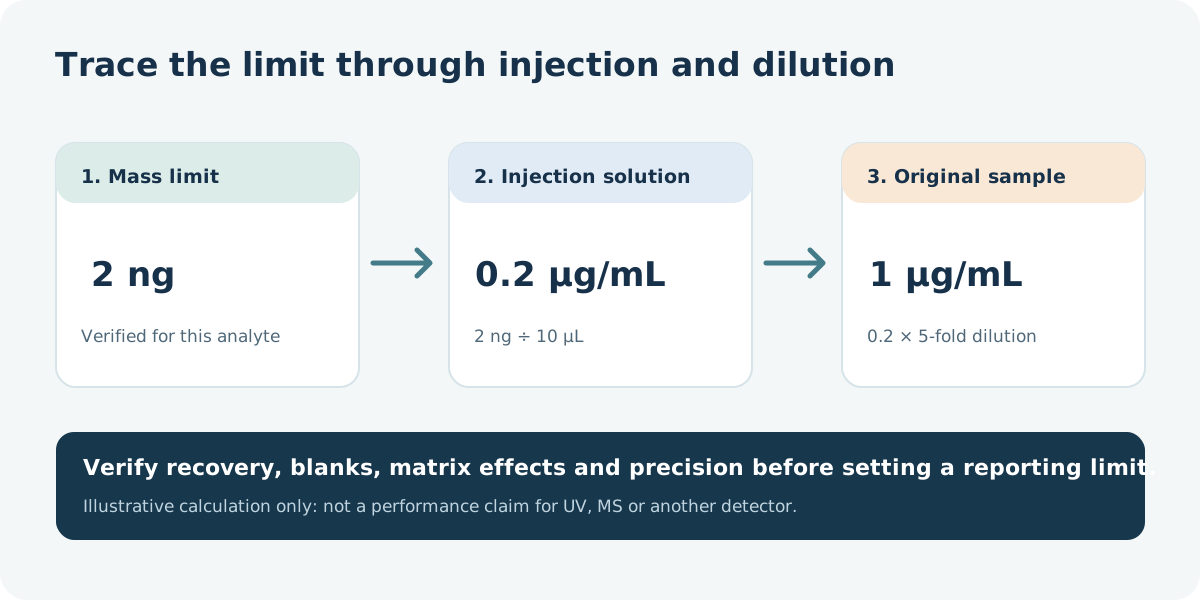
Once a mass limit has been verified for the particular analyte and method, the corresponding concentration in the injection solution is:
Injection-solution limit (µg/mL) = verified on-column mass limit (ng) ÷ injection volume (µL).
For example, suppose a detection limit of 2 ng is established with standards and blanks and the injection volume is 10 µL. The corresponding concentration is 0.2 µg/mL. If the original sample has been diluted fivefold, a simple conversion gives 1 µg/mL in the original sample. This calculation assumes full recovery and no additional interference. A larger injection is not guaranteed to improve the limit proportionally because peak broadening or solvent effects can occur.
The 2 ng in this example is a detection limit, not a quantitation limit. If preparation recovery is 80%, a simple mass balance would raise the original-sample detection-limit equivalent to 1 ÷ 0.80 = 1.25 µg/mL. The actual reporting limit still requires matrix-matched spikes, repeat measurements and blanks; it cannot be fixed by this arithmetic alone.
A limit of detection (LOD) concerns deciding whether an analyte is present under stated conditions. A limit of quantitation (LOQ) is the lowest level at which a numerical result meets the required accuracy and precision. Set the required reporting limit first, then examine blanks, selectivity, recovery and repeatability at that level with real-matrix samples. See the English guide to detection and quantitation limits.
Choose by the question: practical scenarios
↔ 表が見切れている場合は、左右にスクロールしてご覧ください。↔ Scroll the table horizontally to see any hidden columns.
| Analytical question | Initial candidate | What to verify next |
|---|---|---|
| Quantify the main component and UV-absorbing impurities in a pharmaceutical raw material | UV; use PDA to explore wavelengths and compare peaks | Absorbance of key impurities, resolution, low-level accuracy and precision |
| Measure a fluorescent contaminant at trace levels in food | FLD; consider MS for confirmation | Excitation/emission settings, quenching and extraction recovery |
| Run routine sugar measurements in a beverage | RI with isocratic elution | Temperature stability, sugar separation and reporting limit |
| Examine weak UV absorbers such as lipids or surfactants | CAD or ELSD | Analyte volatility, eluent, gradient response and standards |
| Confirm and quantify a low-level metabolite in a biological matrix | LC/MS or tandem MS (LC/MS/MS) | Ionization, isomers, matrix effects and internal standard |
| Search an unknown sample for components a single detector might miss | Combine PDA with CAD/ELSD or MS as appropriate | Blind spots of each detector, flow splitting and detector order |
The same sample can call for a different detector
For a sugar-containing beverage, RI may suit routine monitoring of known sugars. If trace components are the question, consider a validated derivatization–FLD procedure or a suitable MS method. Sample preparation, separation and standards must be designed together; “sugars always need RI” is too simplistic.
For a lipid-containing formulation, UV may be convenient for a UV-active main compound but miss weakly absorbing additives. CAD or ELSD can provide complementary information, and MS may support investigation of unknown impurities. A component may still be invisible to MS. Do not add peak areas from different detector types as though they represented one common total mass.
Settings that can change the result
Even after selecting a principle, unsuitable settings can worsen peak shape or the achievable limit. Check these points during method development:
↔ 表が見切れている場合は、左右にスクロールしてご覧ください。↔ Scroll the table horizontally to see any hidden columns.
| Detector | Settings and conditions to check | What can go wrong |
|---|---|---|
| UV / PDA | Analyte spectrum, wavelength, eluent absorbance, cell and acquisition rate | High background at low wavelengths, missed impurities or too few points across a narrow peak |
| FLD | Excitation/emission wavelengths, solvent, pH and any derivatization reaction | Quenching or variable reaction yield changes peak area at the same concentration |
| RI | Cell and mobile-phase temperature equilibration, reference liquid and pump stability | Baseline drift obscures small peaks |
| ELSD | Nebulizer gas, evaporation temperature, analyte volatility and calibration model | Semivolatile loss or curved low-end response |
| CAD | Gas and eluent cleanliness, additive volatility and gradient response | Higher background/noise or retention-time-dependent response |
| MS | Ionization mode/polarity, eluent, matrix effects and a suitable internal standard | Good response in solvent standards but weak response in a real sample |
With narrow peaks in fast LC, match acquisition rate and detector response time to peak width. Excessive signal averaging can lower apparent noise while making peaks shorter and broader, affecting apparent resolution. Shimadzu's troubleshooting guide discusses acquisition rate and time constant.
Common questions
If PDA spectra match, is the peak a single compound? A match helps but cannot rule out coelution of compounds with similar spectra or a small impurity hidden under a large peak. Compare standards, change the separation and use MS if needed.
Can CAD quantify without standards because it is nearly universal? Its response is less dependent on UV absorbance, but analyte volatility, mobile-phase composition, gradients and nonvolatile coextractives still matter. Verify response and recovery across the intended range before treating an estimate based on a surrogate as a rigorous quantitative result.
Does no MS peak mean the compound is absent? It may ionize poorly, suffer ion suppression, or fall outside the scanned m/z range or chosen polarity. Reconsider ionization conditions or examine the sample with a different detection principle.
Detectors may be coupled in series or with a flow split. A flow-through UV/PDA or FLD cell can sometimes precede MS or an aerosol detector. Confirm instrument specifications, flow rate, extra-column dispersion and waste routing. ELSD, CAD and MS do not recover the analyte as the original liquid stream.
The shortest defensible selection path is: (1) characterize absorbance, fluorescence, ionization and volatility; (2) specify the matrix and needed reporting limit; (3) make the mobile phase compatible; and (4) demonstrate selectivity, recovery and the required limit with spiked samples. The HPLC column selection guide (Japanese) shows how to consider separation and detection as one method.
Worked example: a 1 mg/kg reporting target
Before comparing detector brochures, convert the required concentration into the mass reaching the detector. The following numbers are hypothetical and solely illustrate the calculation. Assume 100% extraction recovery and ignore volumetric uncertainty.
↔ 表が見切れている場合は、左右にスクロールしてご覧ください。↔ Scroll the table horizontally to see any hidden columns.
| Chosen condition | Illustrative value |
|---|---|
| Required reporting limit in the original sample | 1 mg/kg (= 1 µg/g) |
| Sample mass | 5.00 g |
| Final extract volume | 50.0 mL |
| Additional dilution before measurement | 2-fold |
| Injection volume | 10.0 µL |
- At 1 µg/g, the original sample contains 1 µg/g × 5.00 g = 5.00 µg analyte.
- The final extract contains 5.00 µg ÷ 50.0 mL = 0.100 µg/mL.
- Twofold dilution gives an injection solution of 0.0500 µg/mL.
- Injecting 0.0100 mL delivers 0.0500 µg/mL × 0.0100 mL = 0.000500 µg = 0.500 ng.
To report 1 mg/kg under these conditions, demonstrate the required accuracy, precision and selectivity at a concentration equivalent to 0.500 ng injected. A vendor's generic “ng” entry does not establish that performance.
Now suppose the verified quantitation limit of a particular method were 2.00 ng per injection, again only a hypothetical value. At 10.0 µL, that is 0.200 µg/mL in the injection solution. Undoing the twofold dilution gives 0.400 µg/mL in the extract, corresponding to 0.400 × 50.0 ÷ 5.00 = 4.00 mg/kg in the original sample. The current preparation therefore misses the 1 mg/kg target.
Possible changes include concentrating the extract, reducing the additional dilution if selectivity allows, or choosing another detector. Recheck recovery, matrix effects, calibration and peak shape after any change. A fourfold larger injection is not automatically a solution. As with the sample-to-solution conversion guide (Japanese), the mass balance from original sample to injected solution should be documented.
Checklist after a peak appears
Decide numerical acceptance criteria for the intended method before running these checks.
↔ 表が見切れている場合は、左右にスクロールしてご覧ください。↔ Scroll the table horizontally to see any hidden columns.
| Check | What it establishes | When to investigate further |
|---|---|---|
| Solvent, reagent and procedural blanks | Background near the analyte retention time | A blank produces a peak at the sample's position |
| Standard near the proposed limit | Repeatable measurement at the needed level | A visible peak gives unstable area or fails quantitative criteria |
| Spike into the real sample matrix | Combined effects of extraction, coextractives and detection | Solvent standards work but spike recovery or matrix response fails |
| Blank after a high-concentration sample | Carryover | The previous sample leaves a residual signal |
| Reference standard or independent conditions | Evidence distinguishing the target from other peaks | Retention time alone agrees; add separation or independent information |
PDA spectral comparison is one part of this evidence, but cannot detect every coeluting compound with a similar spectrum. The Shimadzu UV/PDA comparison explains its scope. Record the detector principle, preparation factors and actual-sample results together so the selection can be justified later.
References
- Thermo Fisher Scientific: How HPLC Detectors Work
- Shimadzu: UV and PDA Detectors
- Waters: RI detection of sugars in fruit juice
- Shimadzu: Mobile phases compatible with LC/MS
- Thermo Fisher Scientific: CAD and ELSD comparison
- Thermo Fisher Scientific: Gradient effects on CAD response
- Thermo Fisher Scientific: Inverse-gradient compensation for CAD
- Shimadzu: HPLC troubleshooting, acquisition rate and time constant