
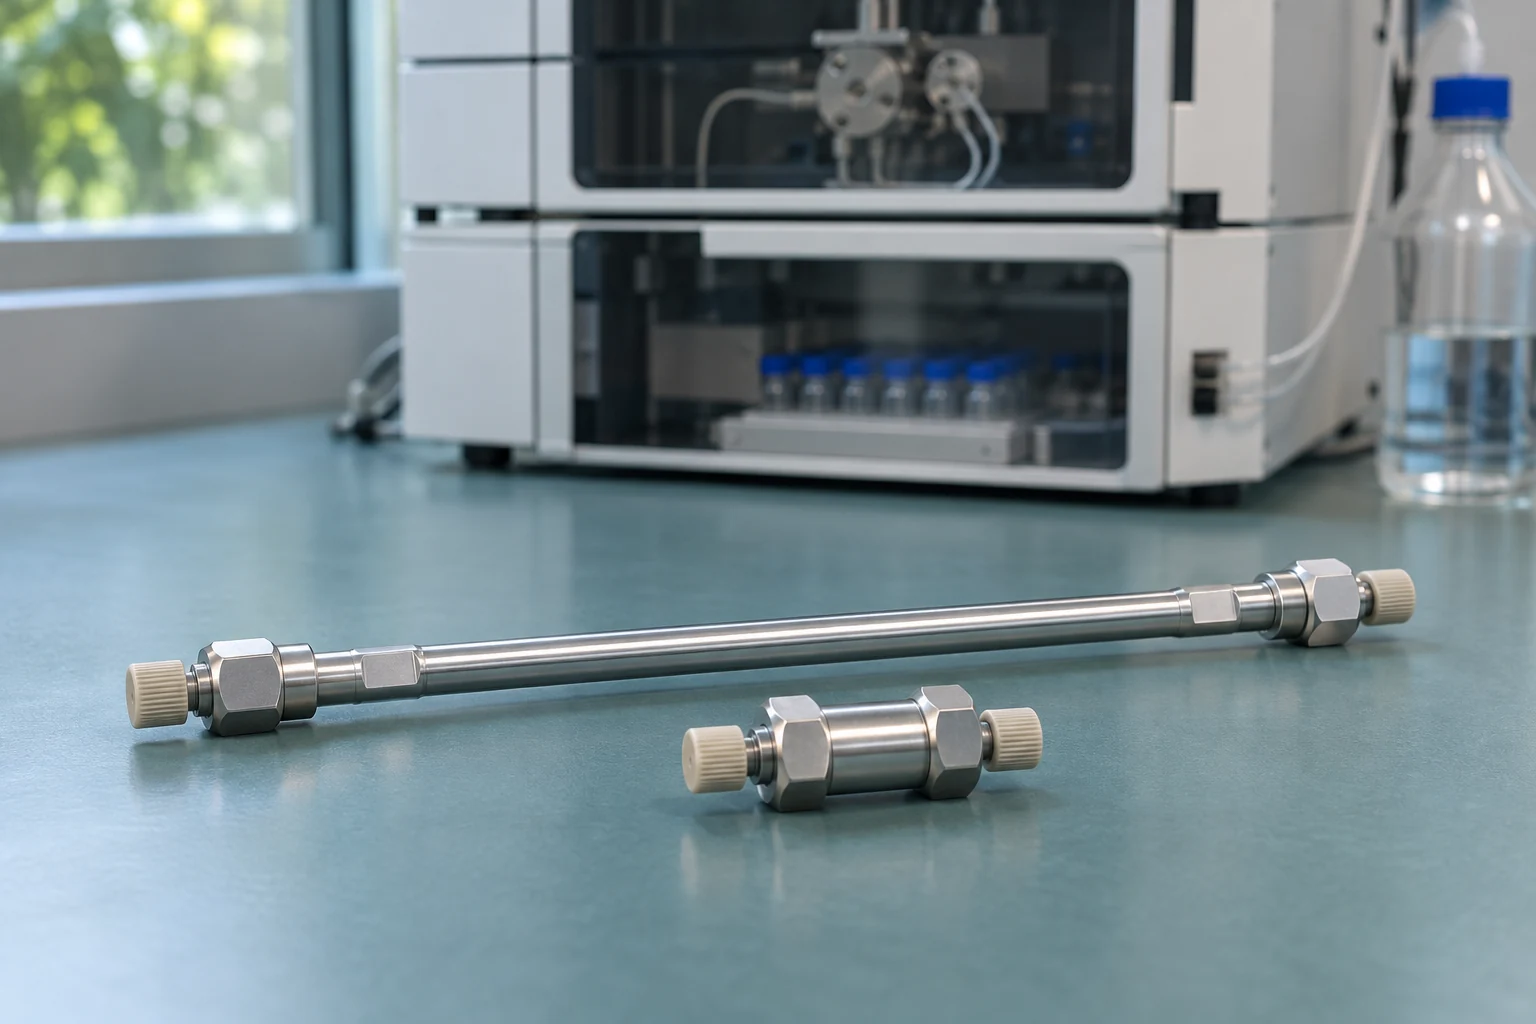
In high-performance liquid chromatography (HPLC), choose the stationary phase for retention and selectivity first. Then use column length, inner diameter and particle size to balance resolution, run time and pressure. If a phosphate-containing analyte gives a small peak area, compare the sample vial, column and instrument flow path before selecting low-adsorption hardware.
This guide starts with reversed-phase separations of small molecules and covers alternatives for polar compounds, charged species and biomolecules. Check the product instructions for pressure, temperature, pH, solvent and flow limits.
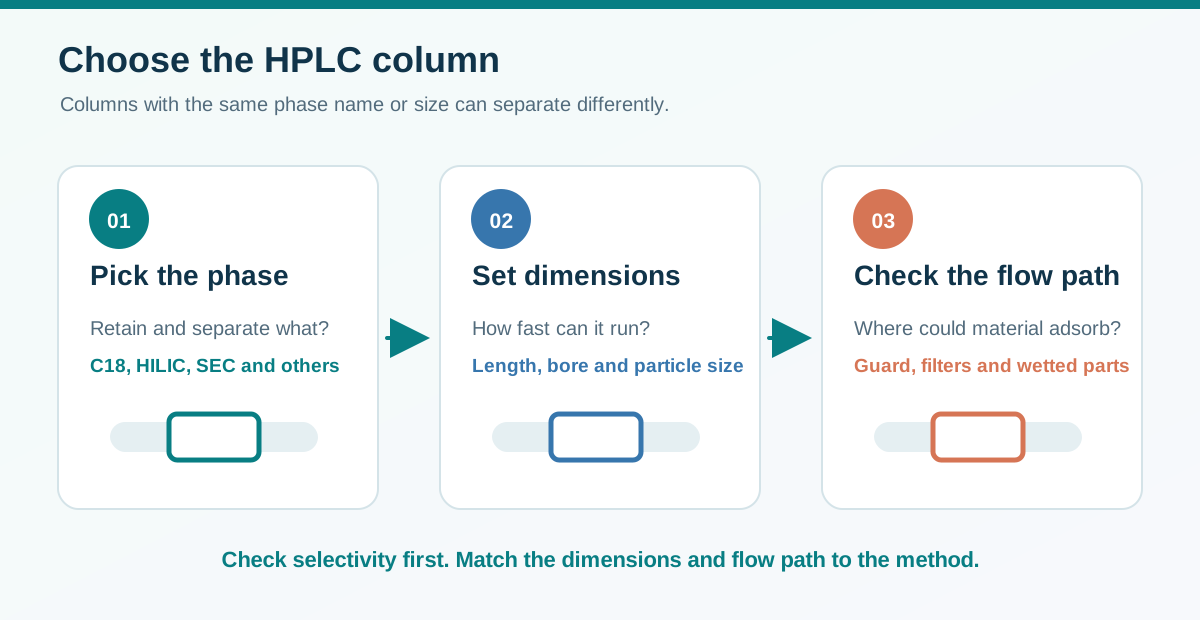
Choose selectivity, dimensions and the flow path in that order
↔ 表が見切れている場合は、左右にスクロールしてご覧ください。↔ Scroll the table horizontally to see any hidden columns.
| Decision | Question to ask | What to check |
|---|---|---|
| Separation mode and stationary phase | Are the analytes retained, and does the critical pair separate? | Retention, elution order, resolution and solvent or pH compatibility |
| Length | What is the shortest column that meets the resolution requirement? | Resolution, run time and pressure |
| Inner diameter | What flow and injection volume suit the system and detector? | Solvent use, injection volume and extra-column dispersion |
| Particle size and structure | Can the system deliver the required efficiency within its pressure limit? | Efficiency and the pressure ratings of the column and system |
| Protection and wetted hardware | Where could particles accumulate or analytes adsorb? | Filter and guard placement, recovery and peak shape |
In a typical packed HPLC column, the stationary phase may be a bonded chemistry on silica particles or a porous material that itself provides the separation. In gas chromatography (GC), a capillary column can use a stationary-phase film on the capillary wall. Agilent HPLC column selection guide · Waters column hardware primer
Stationary phases and separation modes
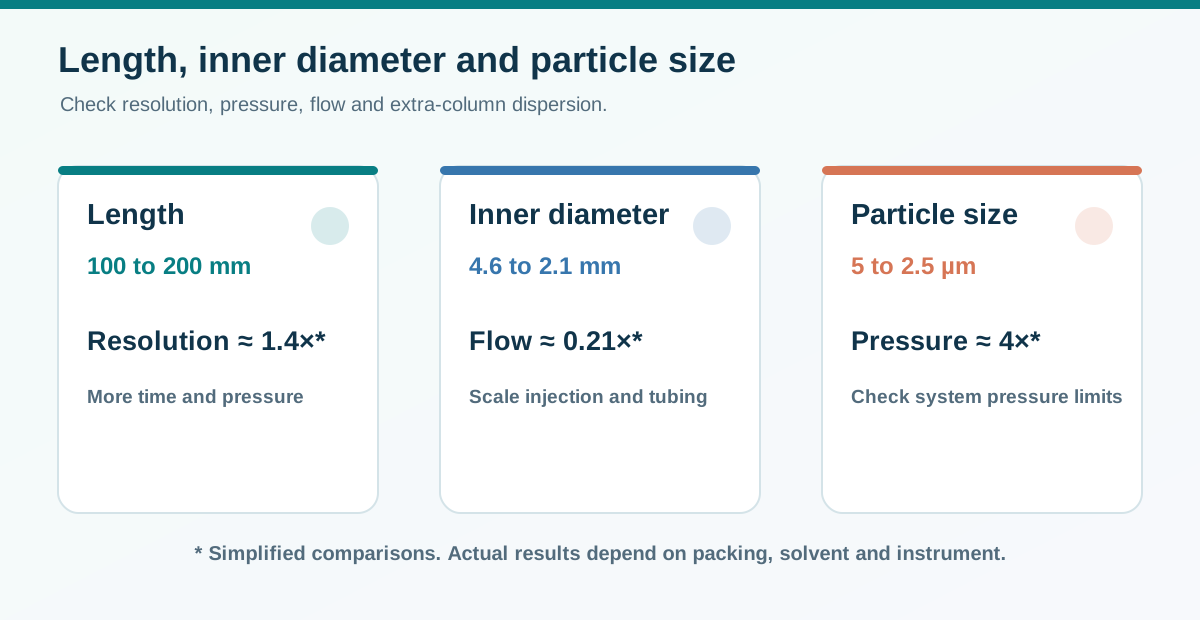
Changing stationary phase or mobile phase can change elution order even if the dimensions stay the same. If a peak elutes close to the void time, try to increase retention. If a retained pair overlaps, investigate selectivity before increasing column length.
↔ 表が見切れている場合は、左右にスクロールしてご覧ください。↔ Scroll the table horizontally to see any hidden columns.
| Mode or phase | Typical starting point | What to check |
|---|---|---|
| Reversed-phase C18 (octadecylsilane, ODS) | Many small organic compounds | Base particle, bonding density, endcapping and pH range |
| Reversed-phase C8 or C4 | Excessive retention on C18, or screening for peptides and proteins | Selectivity and, for large molecules, pore size |
| Phenyl, phenyl-hexyl or pentafluorophenyl (PFP) | Aromatic compounds or a pair that coelutes on C18 | Aromatic and dipolar interactions and the actual elution order |
| Polar-embedded or aqueous-compatible reversed phase | Highly aqueous eluents or selected basic analytes | Specified water content, wettability and peak shape |
| Normal-phase cyano (CN) or bare silica | Differences in polarity that can be exploited in normal phase | Solvent compatibility, water content and the changeover procedure |
| Hydrophilic interaction liquid chromatography (HILIC) | Polar species with weak reversed-phase retention | Organic-rich eluent, equilibration and sample solvent. Partitioning into a water-rich layer and other interactions can contribute. |
| Cation or anion exchange | Charged molecules and proteins | Analyte charge at the working pH, buffer concentration and sample ionic strength |
| Size-exclusion chromatography (SEC), including gel permeation chromatography (GPC) for polymers | Protein aggregates or polymer molar-mass distributions | Pore range, solvent and secondary interactions. Adsorption can distort a size-based separation. |
| Mixed-mode or chiral phases | Difficult pairs requiring more than one interaction, or enantiomers | Use a mode and mobile phase suited to the specific separation |
Examples by manufacturer and separation mode
Verify the exact phase, dimensions, particle specification, pore size and wetted materials. A single product family can contain several chemistries. Use the examples as starting points and compare performance with your own standards.
↔ 表が見切れている場合は、左右にスクロールしてご覧ください。↔ Scroll the table horizontally to see any hidden columns.
| Mode | Examples | What to verify |
|---|---|---|
| Reversed-phase C18 | ZORBAX Eclipse Plus C18 (Agilent), XBridge BEH C18 (Waters) | Base particle, pH range and endcapping |
| Reversed-phase C18, Japanese suppliers | L-column2 ODS (Chemicals Evaluation and Research Institute, Japan), Shim-pack GIST C18 (Shimadzu) | Residual silanol activity and specifications |
| Reversed-phase C8 and C4 | Kinetex C8 (Phenomenex), Hypersil GOLD C4 (Thermo Fisher Scientific) | Different bonded phases. Check pore size for proteins. |
| Reversed-phase C8, Japanese suppliers | L-column2 C8 (Chemicals Evaluation and Research Institute, Japan), Shim-pack GIST C8 (Shimadzu) | Particle and endcapping |
| Phenyl and PFP | Kinetex Phenyl-Hexyl, Kinetex F5 (Phenomenex) | Each ligand gives a different selectivity |
| Phenyl and fluorophenyl, Japanese suppliers | L-column2 C6-Phenyl (Chemicals Evaluation and Research Institute, Japan), Shim-pack GIST PFPP (Shimadzu) | Phenyl-hexyl and pentafluorophenylpropyl ligands |
| Polar-embedded or aqueous-compatible reversed phase | Acclaim PolarAdvantage II (Thermo Fisher Scientific), Atlantis T3 (Waters) | The polar-embedded phase and aqueous-compatible C18 use different designs |
| Aqueous-compatible reversed phase, Japanese supplier | Shim-pack GIST C18 AQ (Shimadzu) | Permitted aqueous composition |
| Normal-phase cyano or silica | Spherisorb CN and Silica (Waters) | Cyano-bonded or bare silica and the required solvent conditioning |
| HILIC | XBridge BEH Amide (Waters), SeQuant ZIC-HILIC (Merck) | Amide and zwitterionic chemistries |
| HILIC, Japanese supplier | Shim-pack GIST Amide (Shimadzu) | Equilibration and sample solvent |
| Ion exchange | Protein-Pak Hi Res IEX (Waters) | Cation or anion exchange and strong or weak ligands |
| Ion exchange, Japanese supplier | Shim-pack WAX and WCX (Shimadzu) | Weak anion or weak cation exchange for the analyte’s charge |
| SEC or GPC | TSKgel SEC (Tosoh), AdvanceBio SEC (Agilent) | Aqueous or organic operation and pore range |
| SEC, Japanese supplier | Shim-pack Bio Diol (Shimadzu) | Pore size relative to the protein or peptide |
| Mixed-mode | Acclaim Mixed-Mode WAX-1 (Thermo Fisher Scientific) | Reversed-phase and weak anion-exchange contributions |
| Chiral | CHIRALPAK IA (Daicel) | Selector chemistry and compatible solvents |
Pore size is a separate choice. Large peptides or proteins may enter small pores only to a limited extent. Choose a pore range that suits the molecular size and mode. Agilent HPLC column selection guide
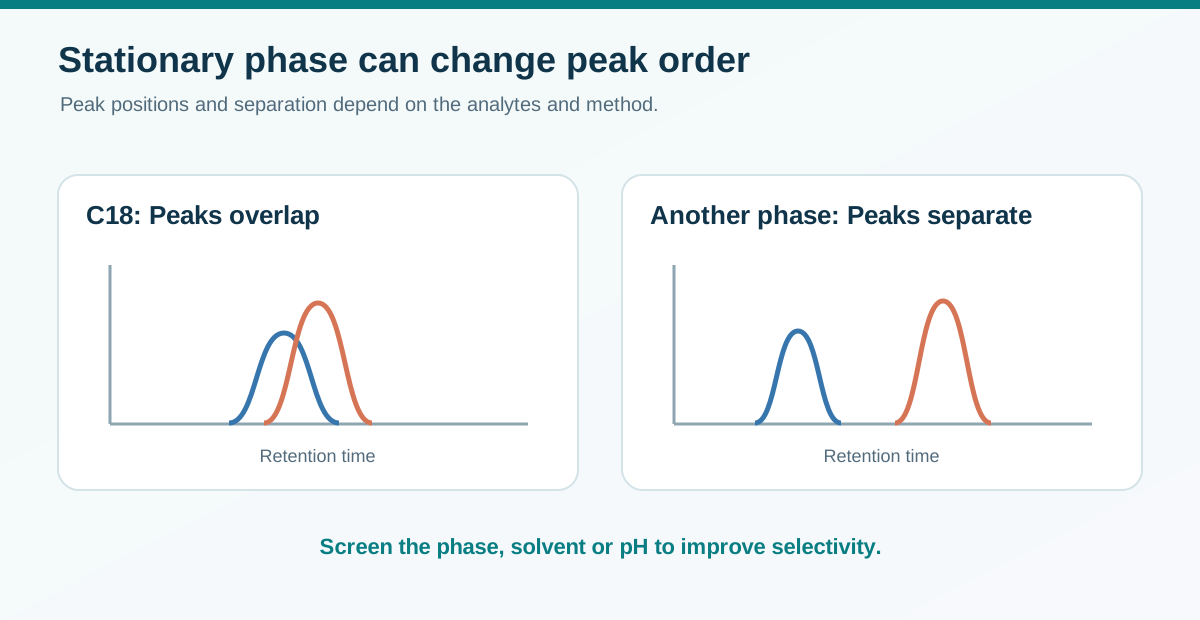
Column length, inner diameter and particle size
Length. With comparable packing and conditions, a longer column can provide more theoretical plates and higher resolution. In a simple comparison at constant plate height, selectivity and retention factor, resolution scales with the square root of length. Doubling length from 100 to 200 mm increases resolution by about 1.4 times, while increasing run time, pressure and solvent consumption at the same flow rate.
Inner diameter. At the same linear velocity, flow scales approximately with cross-sectional area. Moving from 4.6 to 2.1 mm gives (2.1 / 4.6)² ≈ 0.21. A flow of 1.0 mL/min therefore scales to about 0.21 mL/min as a starting point. Scale injection volume to suit column volume and minimise extra-column dispersion from tubing, fittings and the detector cell. With liquid chromatography–mass spectrometry (LC–MS), check flow and ionisation after the transfer.
Particle size. Smaller particles can improve efficiency or shorten the analysis. For otherwise comparable packed columns at the same linear velocity, the pressure drop can scale approximately with the inverse square of particle diameter. Changing from 5 to 2.5 µm gives roughly four times the pressure drop under that approximation. Packing structure, solvent viscosity, temperature and the rest of the flow path also matter. Compare superficially porous and fully porous particles using measured performance and pressure as well as nominal particle size. Waters primer on particle size and pressure
↔ 表が見切れている場合は、左右にスクロールしてご覧ください。↔ Scroll the table horizontally to see any hidden columns.
| Change | Potential benefit | Check at the same time |
|---|---|---|
| 100 to 150 mm length | More resolution for a close pair | Pressure, run time and gradient time |
| 4.6 to 2.1 mm inner diameter | Lower flow and solvent consumption | Injection volume, tubing diameter, detector volume and response |
| 5 to 3 µm particles | Higher efficiency or a faster run | System and column pressure limits and filter loading |
When transferring a gradient method, also consider the gradient time, injection volume and dwell volume, the volume between the point of mobile-phase mixing and the column inlet. Recheck the critical pair, peak shape, quantitative result and system suitability. Waters gradient method scaling example
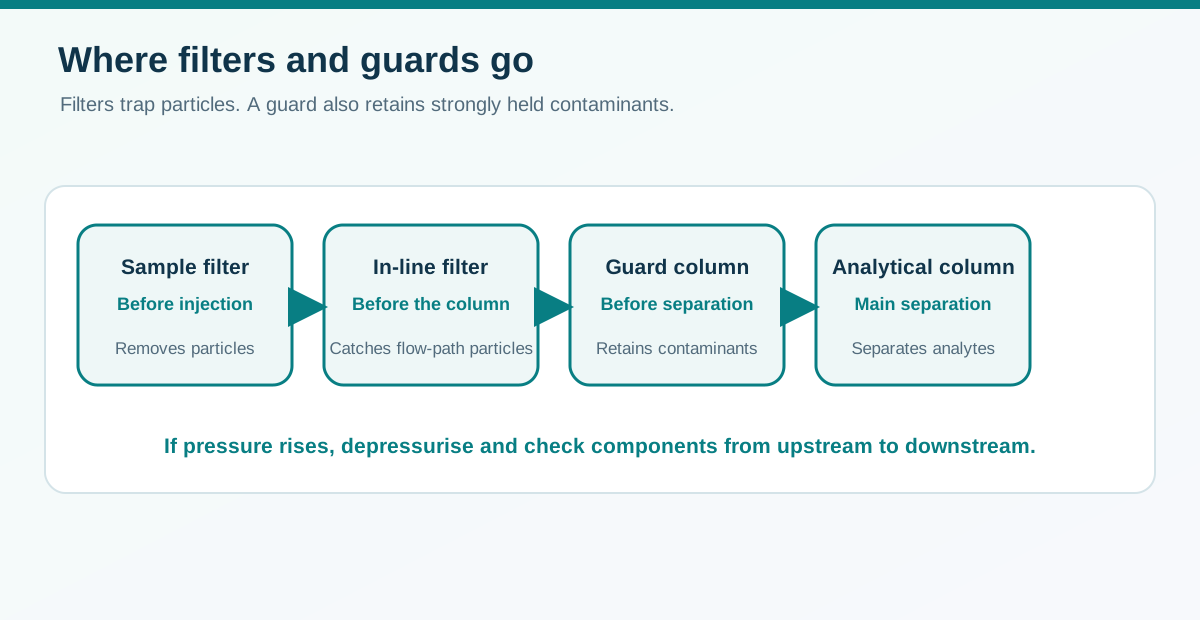
Guard columns, in-line filters and sample filters
↔ 表が見切れている場合は、左右にスクロールしてご覧ください。↔ Scroll the table horizontally to see any hidden columns.
| Component | Main function | What to check |
|---|---|---|
| Sample filter | Removes particles before injection | Analyte adsorption, extractables and solvent compatibility. At trace levels, run a filter blank. Syringe filter selector (Japanese) |
| Mobile-phase filter | Reduces particulates entering the instrument | Filtration, degassing and conditions that prevent precipitation |
| In-line filter | Traps particles immediately upstream of the column assembly | Check it first if pressure rises. Dissolved, strongly retained contaminants can pass through. |
| Guard column | Traps particles and strongly retained contaminants before the analytical column | Choose suitable chemistry and diameter, and check the added pressure, volume and retention effects |
Use appropriately prepared samples with a guard column. Extra guard length or a different phase can change selectivity and retention. Depressurise the system before checking for restrictions. Work from the filter to the guard and then the analytical column. Follow the column instructions for any reverse flushing. Thermo Fisher Scientific guide to guard columns
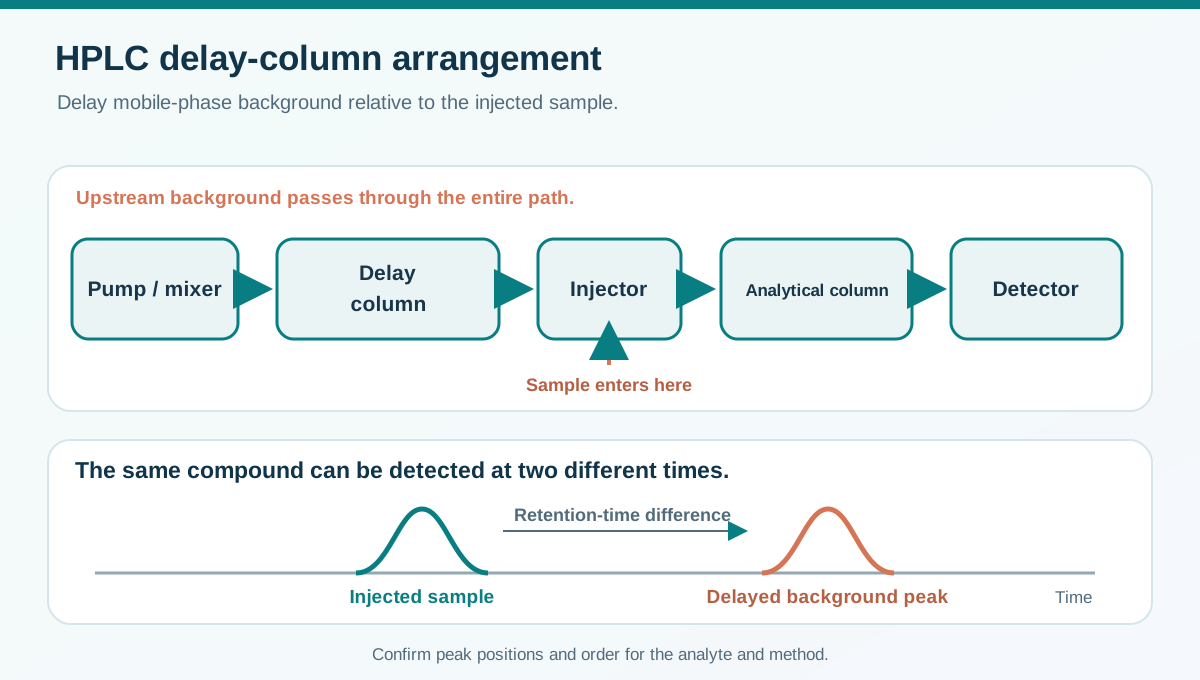
A delay column can separate mobile-phase background from a sample peak
In the retention-gap method described for some liquid chromatography systems, a delay column, also called an isolator column, is installed between the pump or mixer and the injector. It delays contaminants from the mobile phase or upstream solvent-delivery system. The injected sample bypasses the delay column, so the same compound can appear at different times depending on its source.
↔ 表が見切れている場合は、左右にスクロールしてご覧ください。↔ Scroll the table horizontally to see any hidden columns.
| Stream | Path and effect |
|---|---|
| Mobile phase | Pump and mixer, delay column, injector, analytical column, then detector |
| Upstream background contaminant | Temporarily retained in the delay column before reaching the analytical column |
| Injected sample | Enters downstream of the delay column and reaches the analytical column directly |
Tsuda and colleagues compared 50 and 100 mm delay columns for trace perfluorobutanoic acid (PFBA) and found 100 mm more effective for separating the background and sample peaks in their setup. Choose dimensions by checking the blank and target peaks in your own method. The added column changes pressure and can affect gradient delay. Check for interference with other analytes and continue to reduce contamination at its source. Contamination introduced at or after the injector bypasses the delay column. Tsuda et al., conference abstract (Japanese) · Waters example of isolator-column placement
If a strong sample solvent causes peak fronting, splitting or broadening, check the injection volume, sample solvent and initial mobile phase. A guard column is normally installed downstream of the injector to protect the analytical column, and a trap column can concentrate the injected sample. The pre-injector delay column addresses upstream background.
Low-adsorption columns and bioinert flow paths
A low-adsorption column can use treated wetted surfaces on the tube wall and the frits that retain the packing. A bioinert flow path also addresses surfaces elsewhere in the instrument, such as the injection assembly, tubing and valves. For either description, check the actual wetted components, materials and treatments. Waters comparison of metal-sensitive analyte recovery across LC systems · Agilent bio-inert system specifications
Phosphate-containing nucleotides and oligonucleotides, and some other metal-sensitive analytes, can give small areas, tailing or a low first-injection response after contact with metallic surfaces. Losses in the vial or strong retention on the stationary phase can also reduce the observed area. Waters nucleotide application study · Waters vial adsorption study
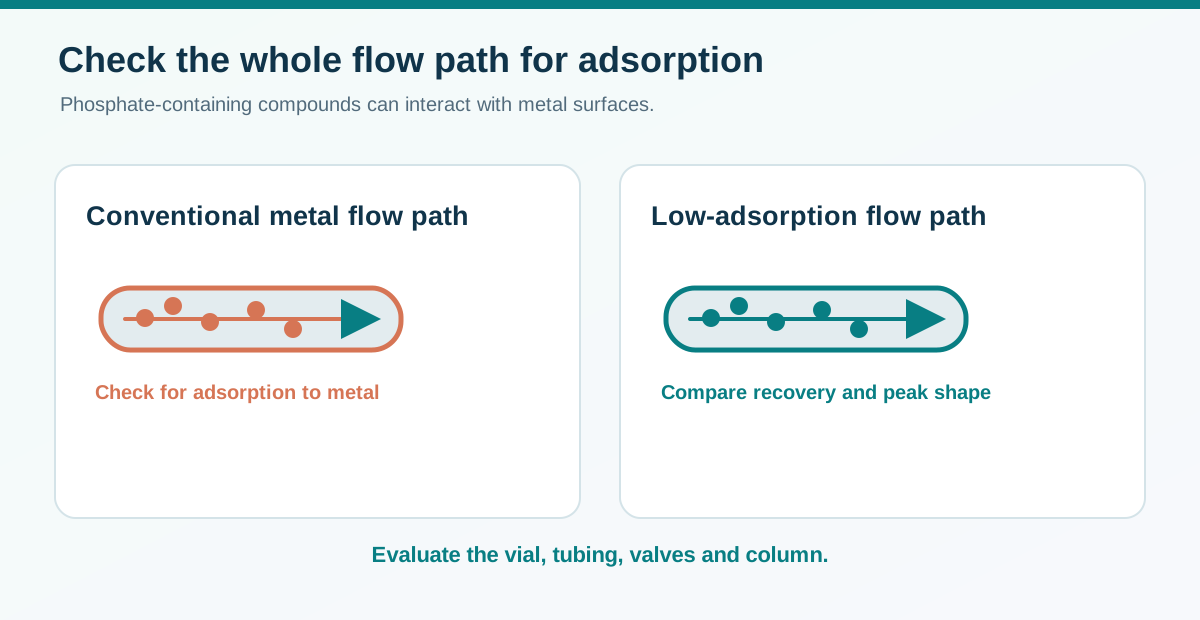
How to investigate a low peak area
Use a standard near the reporting limit and change one component at a time. Compare areas, tailing and first-injection versus repeat-injection response. Run a blank after a high-concentration sample to check carryover.
↔ 表が見切れている場合は、左右にスクロールしてご覧ください。↔ Scroll the table horizontally to see any hidden columns.
| Observation | Comparison to run | How to interpret the result |
|---|---|---|
| Area falls as the sample waits in the vial | Split the same standard into conventional and low-adsorption vials. Compare fresh and held aliquots. | Look for vial effects and check sample stability, degradation peaks and evaporation. |
| The first injection gives a smaller area than repeated injections | Compare a conventional and a low-adsorption column with matching phase and dimensions. Use comparable equilibration for both. | If the initial deficit is smaller on the low-adsorption column, its wetted surfaces are a plausible contributor. |
| Changing to a low-adsorption column has little effect | Keep the column and vial fixed and check the injection system and tubing. | Also consider strong stationary-phase retention and ion suppression in LC–MS. |
Suppose the first injection gives 60% of the stable repeat-injection peak area on a conventional column and 95% on a comparable low-adsorption column. Each percentage is the first area relative to the stable area on that same column. A matrix spike recovery experiment answers a separate question. Before adopting the column, check repeatability near the reporting limit, peak shape and recovery in real samples. A change in separation or mobile-phase composition at elution can also change detector response. Waters first- and repeat-injection comparison for oligonucleotides · HPLC peak troubleshooting
Five practical column-selection examples
↔ 表が見切れている場合は、左右にスクロールしてご覧ください。↔ Scroll the table horizontally to see any hidden columns.
| Situation | What to try first | What to measure |
|---|---|---|
| Two impurities overlap on C18 | Adjust pH, organic solvent or gradient. Screen phenyl or PFP if more selectivity is needed. | Resolution of the critical pair and reproducibility |
| A polar analyte has little reversed-phase retention | Try HILIC or ion exchange as appropriate. Review sample solvent and equilibration. | Retention factor, peak shape and blank |
| An LC–MS method uses too much solvent | Evaluate 2.1 mm instead of 4.6 mm and optimise flow, injection volume and tubing. | Response, resolution and pressure |
| Protein or nucleic acid recovery is low | Check the pore range and mode. Test standards on comparable low-adsorption hardware. | Recovery, tailing and first- versus repeat-injection area |
| Mobile-phase background overlaps a sample peak in a method for per- and polyfluoroalkyl substances (PFAS) | Locate the contamination source and consider an upstream delay column. | Separation of blank and sample peaks, recovery and added pressure |
Before ordering, record the analytes, matrix, critical resolution, system pressure limit, detector and mobile phase. After installation, keep the part number, lot, dimensions, phase, pore size and first-use date. Record filter and guard replacements and save initial pressure, retention times and standard chromatograms. Choosing chromatographic vials and caps (Japanese)
How to use the references in your own method
↔ 表が見切れている場合は、左右にスクロールしてご覧ください。↔ Scroll the table horizontally to see any hidden columns.
| Source | What it tells you | What to check in your method |
|---|---|---|
| Product specification or manual | Part number, dimensions, phase and operating limits | Separation and recovery for your own sample |
| Manufacturer application note | Performance for a stated instrument, analyte and method | Method transfer, matrix effects and suitability |
| Technical primer | Principles of pressure, scaling and extra-column dispersion | The actual limit and performance of a given product |
Even two C18 columns with the same dimensions can differ in substrate, pore size or surface treatment. Compare resolution of the critical pair, pressure and quantitative results before treating them as interchangeable. For detection choices, see the companion guide. HPLC detector selection