
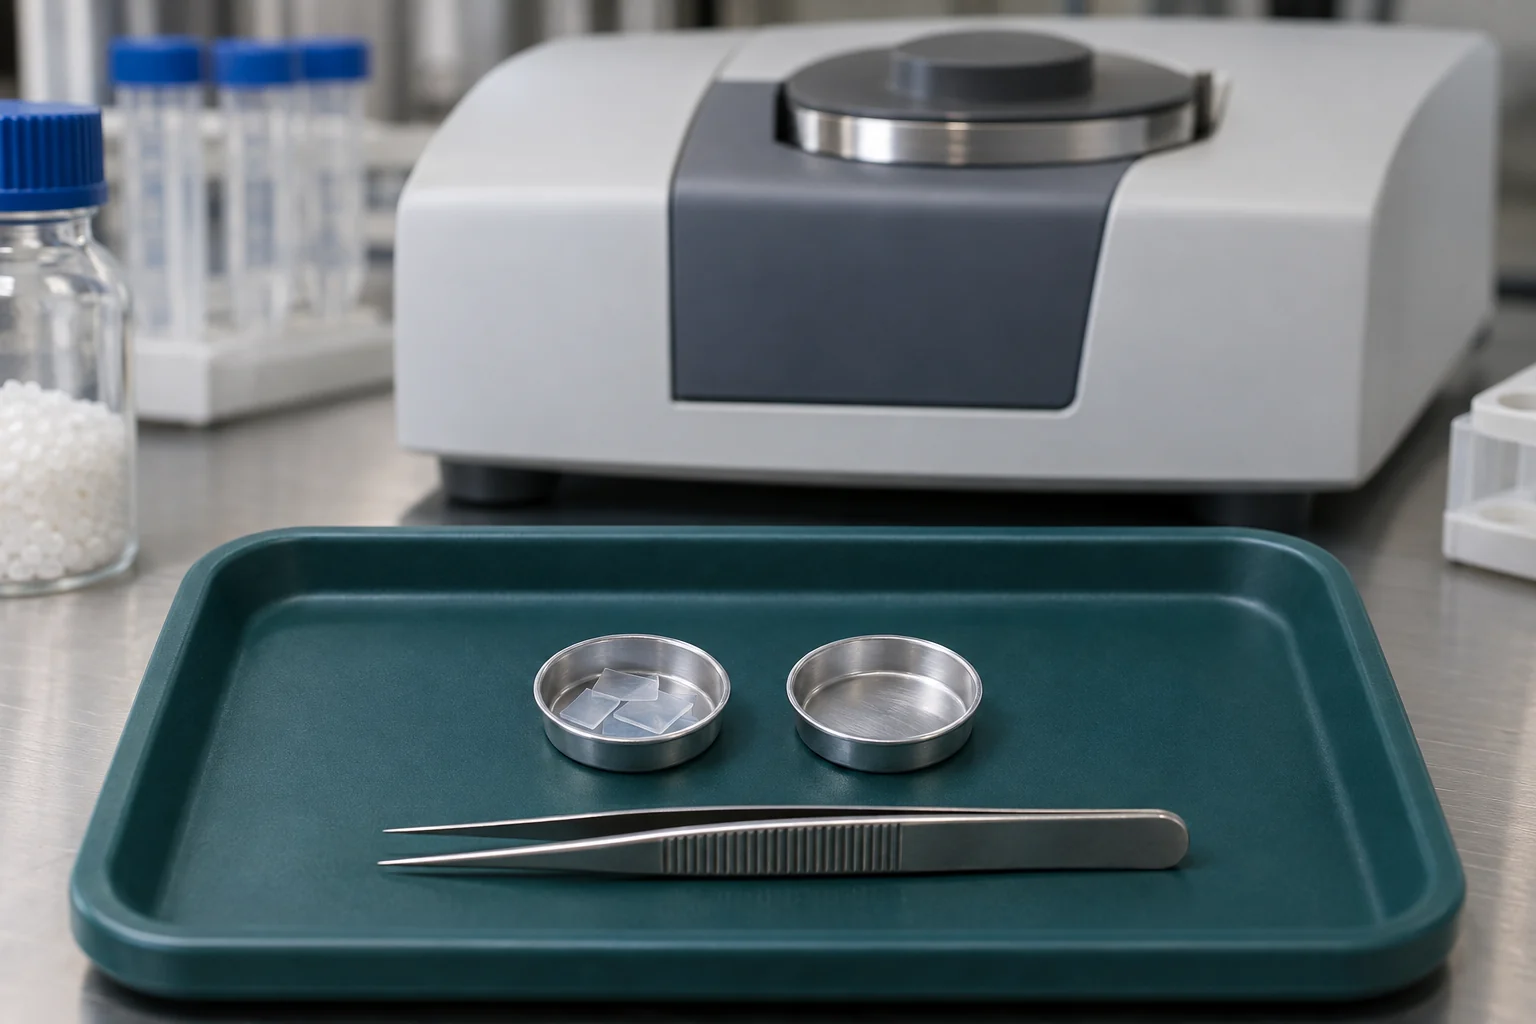
Glass transition temperature (Tg) is a representative point within the range where segments of polymer chains in amorphous regions become more mobile. The material can become more flexible, and its heat capacity changes. In differential scanning calorimetry (DSC), the transition normally appears as a step in the heat-flow baseline. A peak superimposed on that step can reflect the sample’s storage and thermal history. NIMS PoLyInfo polymer property guide · ASTM E1356-25
Glass transition temperature vs melting temperature
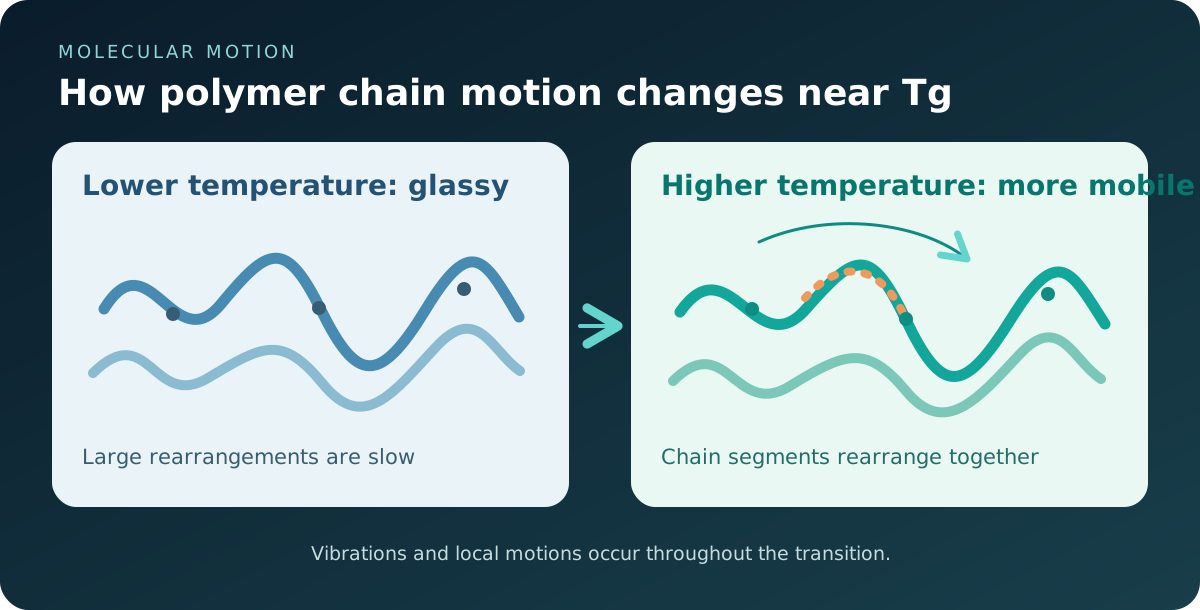
Amorphous regions lack the long-range order of crystals. At low temperatures, their atoms still vibrate and local motions continue, but larger changes in chain configuration are slow. On warming, more segments can rearrange cooperatively during the time available to the measurement.
↔ 表が見切れている場合は、左右にスクロールしてご覧ください。↔ Scroll the table horizontally to see any hidden columns.
| Below Tg | Near Tg | Above Tg |
|---|---|---|
| Large-scale segmental rearrangements are slow. The material often feels stiff and glassy. | The time needed for segments to rearrange becomes comparable to the observation time. Stiffness and heat capacity can change appreciably. | Segmental motion is faster and the material can become more compliant. |
↔ 表が見切れている場合は、左右にスクロールしてご覧ください。↔ Scroll the table horizontally to see any hidden columns.
| What to compare | Glass transition temperature (Tg) | Melting temperature (Tm) |
|---|---|---|
| Where it occurs | Amorphous regions | Crystalline regions |
| What changes | Segments can rearrange more readily on the observation timescale | Crystals melt and lose their ordered structure |
| Typical DSC feature | A baseline step from a change in heat capacity | An endothermic melting peak |
A semicrystalline sample of polyethylene terephthalate (PET) can show both features. Its amorphous regions become more mobile near Tg while its crystals can still support the material. The crystals melt at a higher temperature, producing a separate endotherm. NIMS PoLyInfo polymer property guide · Plastic melting points and heat deformation
What moves near Tg?
Think of turning around in a crowded train. You need the people next to you to shift as well. A segment of a polymer chain likewise rearranges with the help of motion in its surroundings. Warming speeds up these rearrangements without breaking the chain’s chemical bonds. The resulting changes can affect elastic modulus, viscoelasticity, thermal expansion and heat capacity. Research on molecular motion and glass transition in polymers
Tg depends on how and when you observe it. A slow DSC scan and a short mechanical test give the material different amounts of time to respond. When comparing results, check the method, heating rate, thermal history and the criterion used to assign Tg. NIMS PoLyInfo polymer property guide
What changes in different classes of polymer?
In amorphous thermoplastics such as polystyrene and poly(methyl methacrylate) (PMMA), stiffness can drop markedly through the transition. In semicrystalline thermoplastics, crystals can still support the material above Tg. A cured epoxy can have a Tg too. Its crosslinked network remains above that temperature and continues to constrain the polymer even as the material softens. ISO 11357-1:2023
Why does molecular weight affect Tg?
For many linear polymers of the same chemistry, Tg rises as molecular weight increases at the low end of the range, then approaches a limiting value. Short chains have more ends per unit mass. Their end groups and the way those ends interact with neighbouring chains can therefore have a larger influence on segmental motion. The direction and magnitude of the effect depend on the polymer and end-group chemistry. Fox and Flory’s study of polystyrene · Research on free volume and polymer glass transition
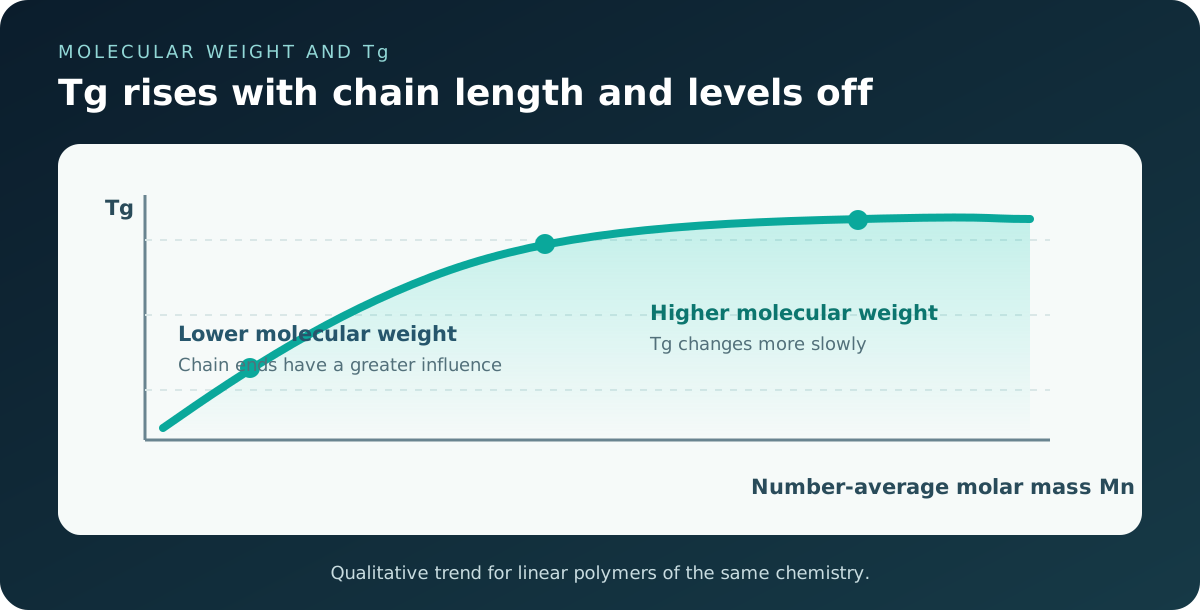
The empirical Fox–Flory equation expresses this trend as Tg ≈ Tg,∞ − K/Mₙ. Here, Mₙ is the number-average molecular weight, Tg,∞ is the limit for very long chains, and K is a constant for the system. Doubling Mₙ halves the size of the molecular-weight correction in this model.
↔ 表が見切れている場合は、左右にスクロールしてご覧ください。↔ Scroll the table horizontally to see any hidden columns.
| Comparison | What to control or check |
|---|---|
| Different molecular weights of the same polymer | Molecular weight distribution, end groups, comonomer ratio and additives |
| Before and after ageing or degradation | Chain scission, oxidation, crosslinking and loss of plasticiser |
| Different polymers | Backbone stiffness and intermolecular interactions as well as molecular weight |
How to read the DSC onset and midpoint
Extend the baselines from the low- and high-temperature sides into the transition region. The extrapolated onset is where the low-temperature baseline meets the tangent at the steepest part of the step. The midpoint is where the curve crosses the halfway level between the extrapolated baselines. These criteria can give different temperatures. Record the criterion used and follow the applicable test method. IUPAC Gold Book characteristic temperatures · TA Instruments DSC examples
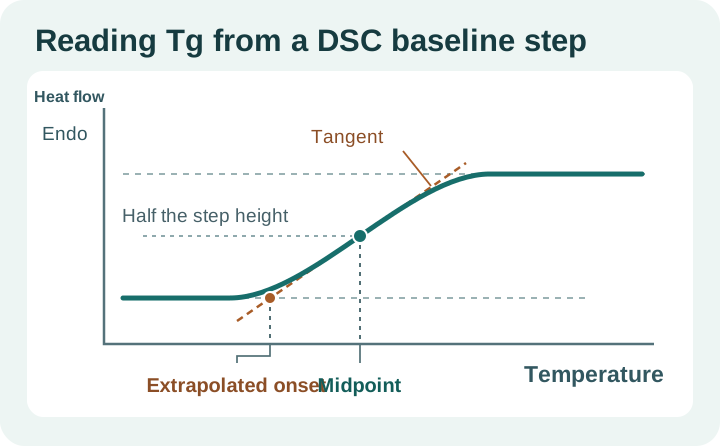
In an illustrative scan at 10 °C/min, the extrapolated onset is 75 °C and the midpoint is 80 °C. A result could read Tg (midpoint) = 80 °C, second heating, 10 °C/min. Use the first heating to learn about the sample as received. Use a second heating after controlled cooling when you need to compare samples after a common thermal history and the first cycle leaves the material chemically unchanged. ISO 11357-2:2020 · ASTM E1356-25
Why is there an endothermic peak near Tg?
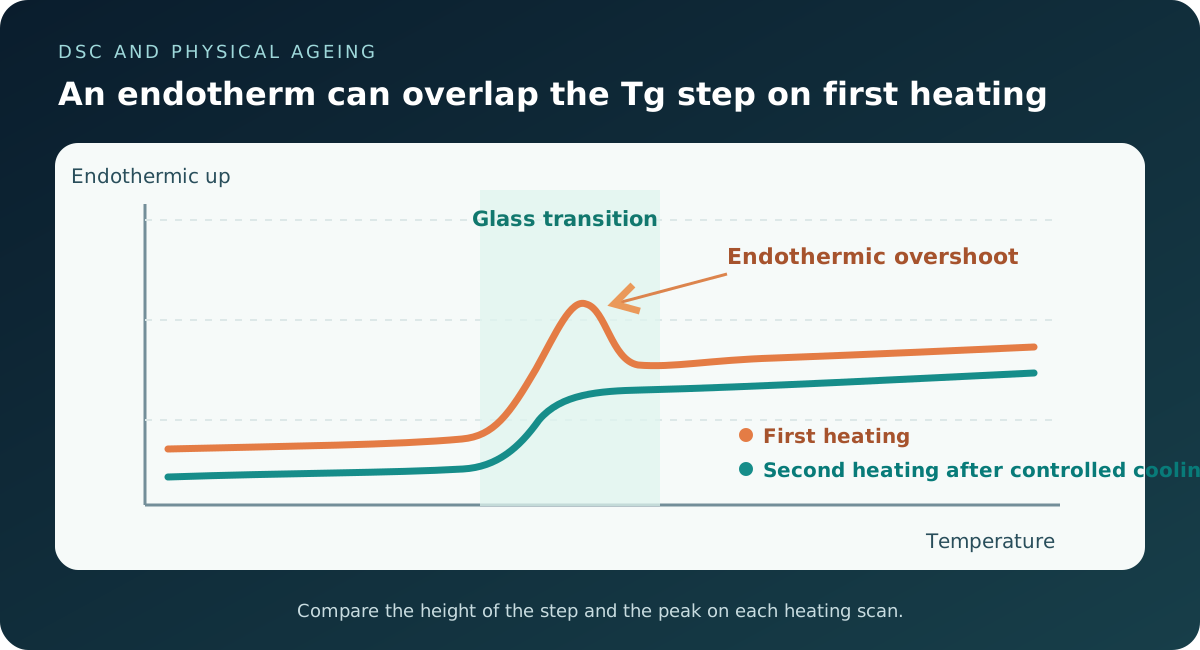
When a polymer glass is first cooled, it retains some of the molecular arrangement characteristic of higher temperatures. During storage below Tg, its structure gradually relaxes and its enthalpy decreases. This enthalpy relaxation is part of physical ageing. On reheating through the transition, the aged glass absorbs extra heat as its structure catches up with the higher-temperature state. This enthalpy recovery can appear as an endothermic overshoot superimposed on the heat-capacity step. Research on the non-equilibrium behaviour of glasses · TA Instruments, enthalpy recovery in DSC
↔ 表が見切れている場合は、左右にスクロールしてご覧ください。↔ Scroll the table horizontally to see any hidden columns.
| What you see | Possible interpretation | What to check |
|---|---|---|
| Baseline step | Heat-capacity change at the glass transition | Onset, midpoint and step height |
| Endothermic overshoot near the step, stronger on first heating | Enthalpy recovery from physical ageing | Storage history and the second scan after controlled cooling |
| Endotherm without a clear step | Melting, evaporation or another overlapping event | Temperature range, sample history, mass change where relevant and repeat measurements |
Suppose the first scan has an endothermic maximum at 86 °C near the step. After controlled cooling, the overshoot is smaller and the step midpoint on the second scan is 80 °C. Report 86 °C as the first-scan peak and 80 °C as the second-scan Tg midpoint. A smaller overshoot on reheating is consistent with physical ageing, but moisture loss or melting history can also change between scans. Where a conventional DSC trace is hard to interpret, temperature-modulated DSC can help resolve the heat-capacity step and the overlapping recovery. TA Instruments, modulated DSC worked example
Compare Tg and Tm when identifying a polymer
Use the two temperatures together to narrow the possibilities, and compare the measurement method, scan number and Tg criterion with those used for the reference values. Then check other evidence, such as the sample’s infrared spectrum. Polymer Tg and Tm lookup tool (Japanese) · Using Tg and Tm to screen polymer candidates (Japanese)